Bitcoin is approaching the lower boundary of its broader ascending channel after extending its decline toward $71K. Buyers have responded near short-term demand, but failed recoveries and heating futures activity leave the market vulnerable to further volatility.
Bitcoin Price Analysis: The Daily Chart
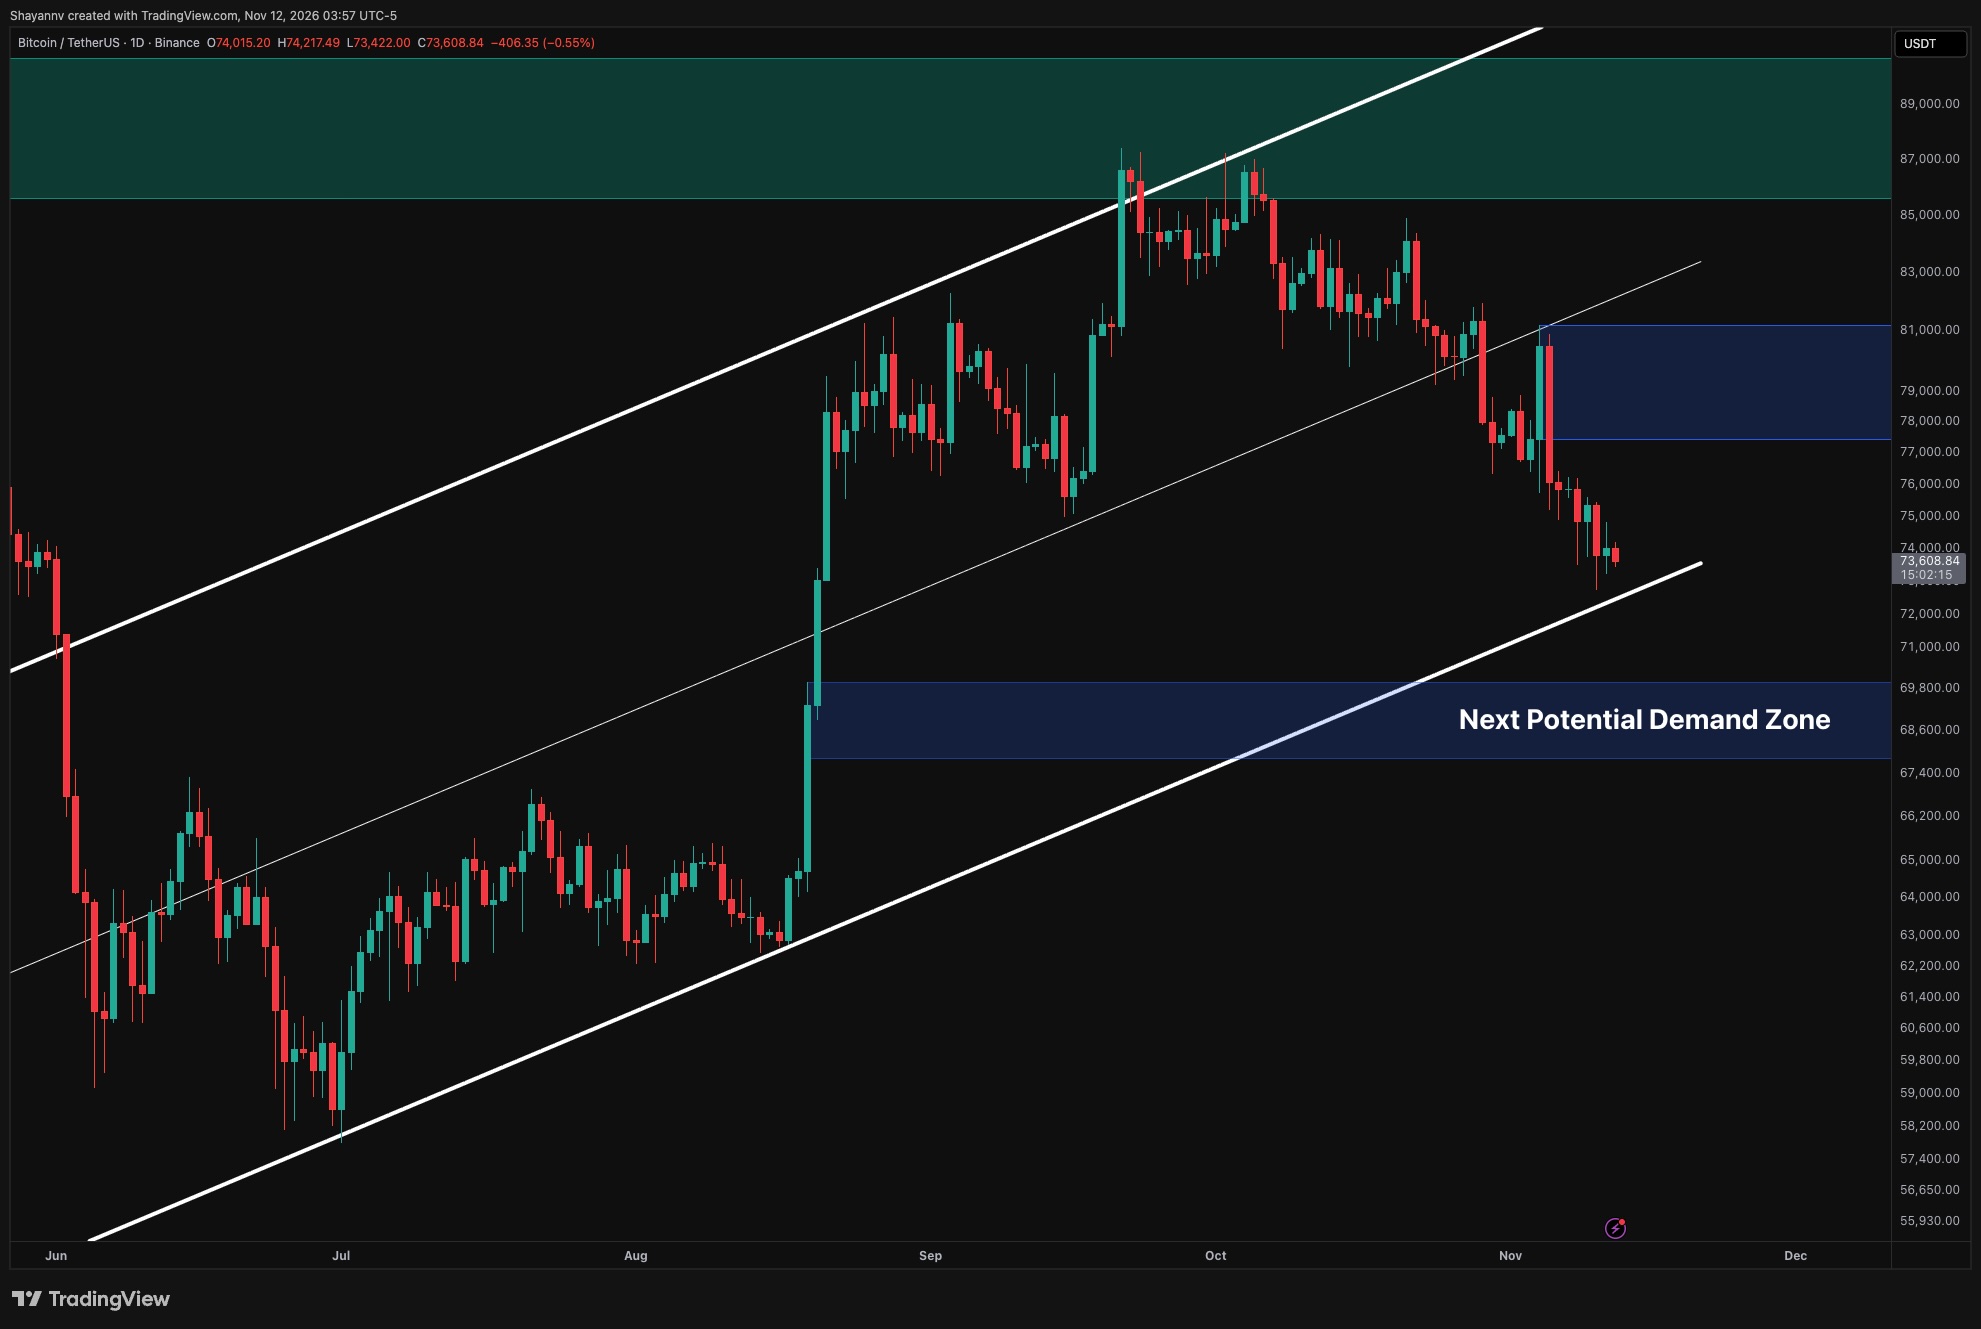
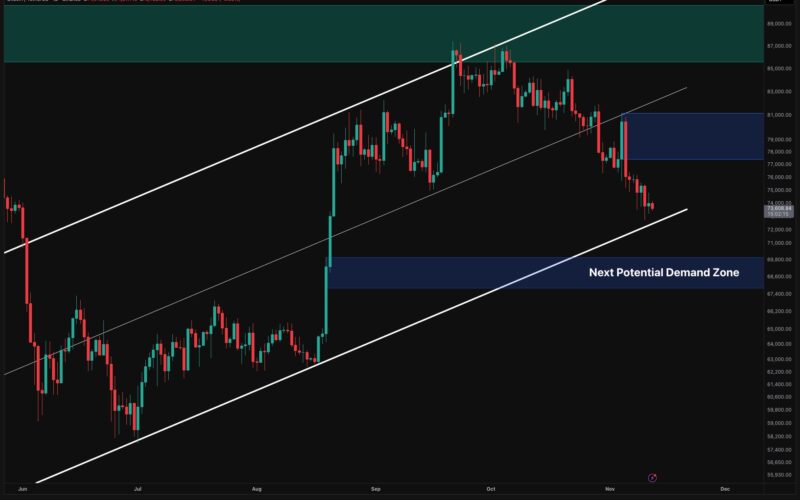
The daily chart shows Bitcoin continuing to form lower highs and lower lows after losing the ascending channel’s midpoint. The failed recovery toward $81K was followed by sustained selling, with the price now approaching the channel’s lower boundary around $70K-$71K.
This trendline is an important test of the broader rising structure. Although the recent decline produced a lower wick near $71K, the subsequent rebound has been modest. Buyers have yet to establish a convincing reversal, leaving the channel support exposed to another test.
A sustained daily close beneath the lower boundary would signal a more significant structural breakdown and increase the risk of an extension toward the marked $67.8K–$69.8K demand zone. This area lies within August’s strong upward expansion and represents the next substantial horizontal support highlighted on the chart.
Alternatively, defending the channel could support a relief rally. Bitcoin would first need to recover $75K–$76K, while the broader $77.4K–$81K supply zone remains the main obstacle to a meaningful improvement in the daily outlook.
BTC/USDT 4-Hour Chart
The four-hour chart shows Bitcoin trading beneath the lower boundary of its descending channel. Recent attempts to recover that boundary have failed, suggesting that the broken trendline is acting as resistance around $74.2K–$74.5K.
The latest selloff briefly entered the upper portion of the $71.1K–$72.9K demand zone before rebounding. However, buyers could not sustain the recovery above $74K, and the price has returned toward $71.5K. This preserves the bearish sequence and keeps another test of demand in focus.
If the recent low around $72.7K gives way, Bitcoin could move deeper into the four-hour demand zone toward $71K–$72K. A stronger buying response is needed to demonstrate that this area can interrupt the decline.
On the upside, reclaiming the broken channel boundary would ease immediate pressure, but the $75.5K–$77K supply zone remains the more important confirmation area. Sustained acceptance above that zone would weaken the short-term continuation setup and create room for a broader recovery.

Sentiment Analysis
The Futures Volume Bubble Map shows a cluster of heating readings accompanying Bitcoin’s recent decline from approximately $76K toward $74K. This contrasts with the predominantly neutral readings seen through much of the preceding correction and indicates that futures trading activity has intensified near the latest lows.
Higher activity during a decline can accompany aggressive selling, hedging, liquidations, or buyers absorbing supply. The metric alone cannot distinguish between these forces or establish whether new positions are being opened. The latest observations also remain in the heating category rather than overheating.
Combined with the weak technical structure, the cluster suggests that Bitcoin is entering an increasingly contested support area. Continued heating alongside a confirmed loss of the daily channel boundary could accompany further downside volatility. Conversely, a strong recovery through nearby resistance would provide better evidence of absorption. The volume readings highlight increased participation, but do not yet confirm capitulation or a durable bottom.

Disclaimer: Information found on CryptoPotato is those of writers quoted. It does not represent the opinions of CryptoPotato on whether to buy, sell, or hold any investments. You are advised to conduct your own research before making any investment decisions. Use provided information at your own risk. See Disclaimer for more information.
Source link