Bitcoin has slipped beneath the $74K support area, leaving buyers struggling to regain control near $74.5K. The latest breakdown increases the risk of a deeper correction, while the liquidation heatmap highlights nearby concentrations on both sides of the market.
Bitcoin Price Analysis: The Daily Chart
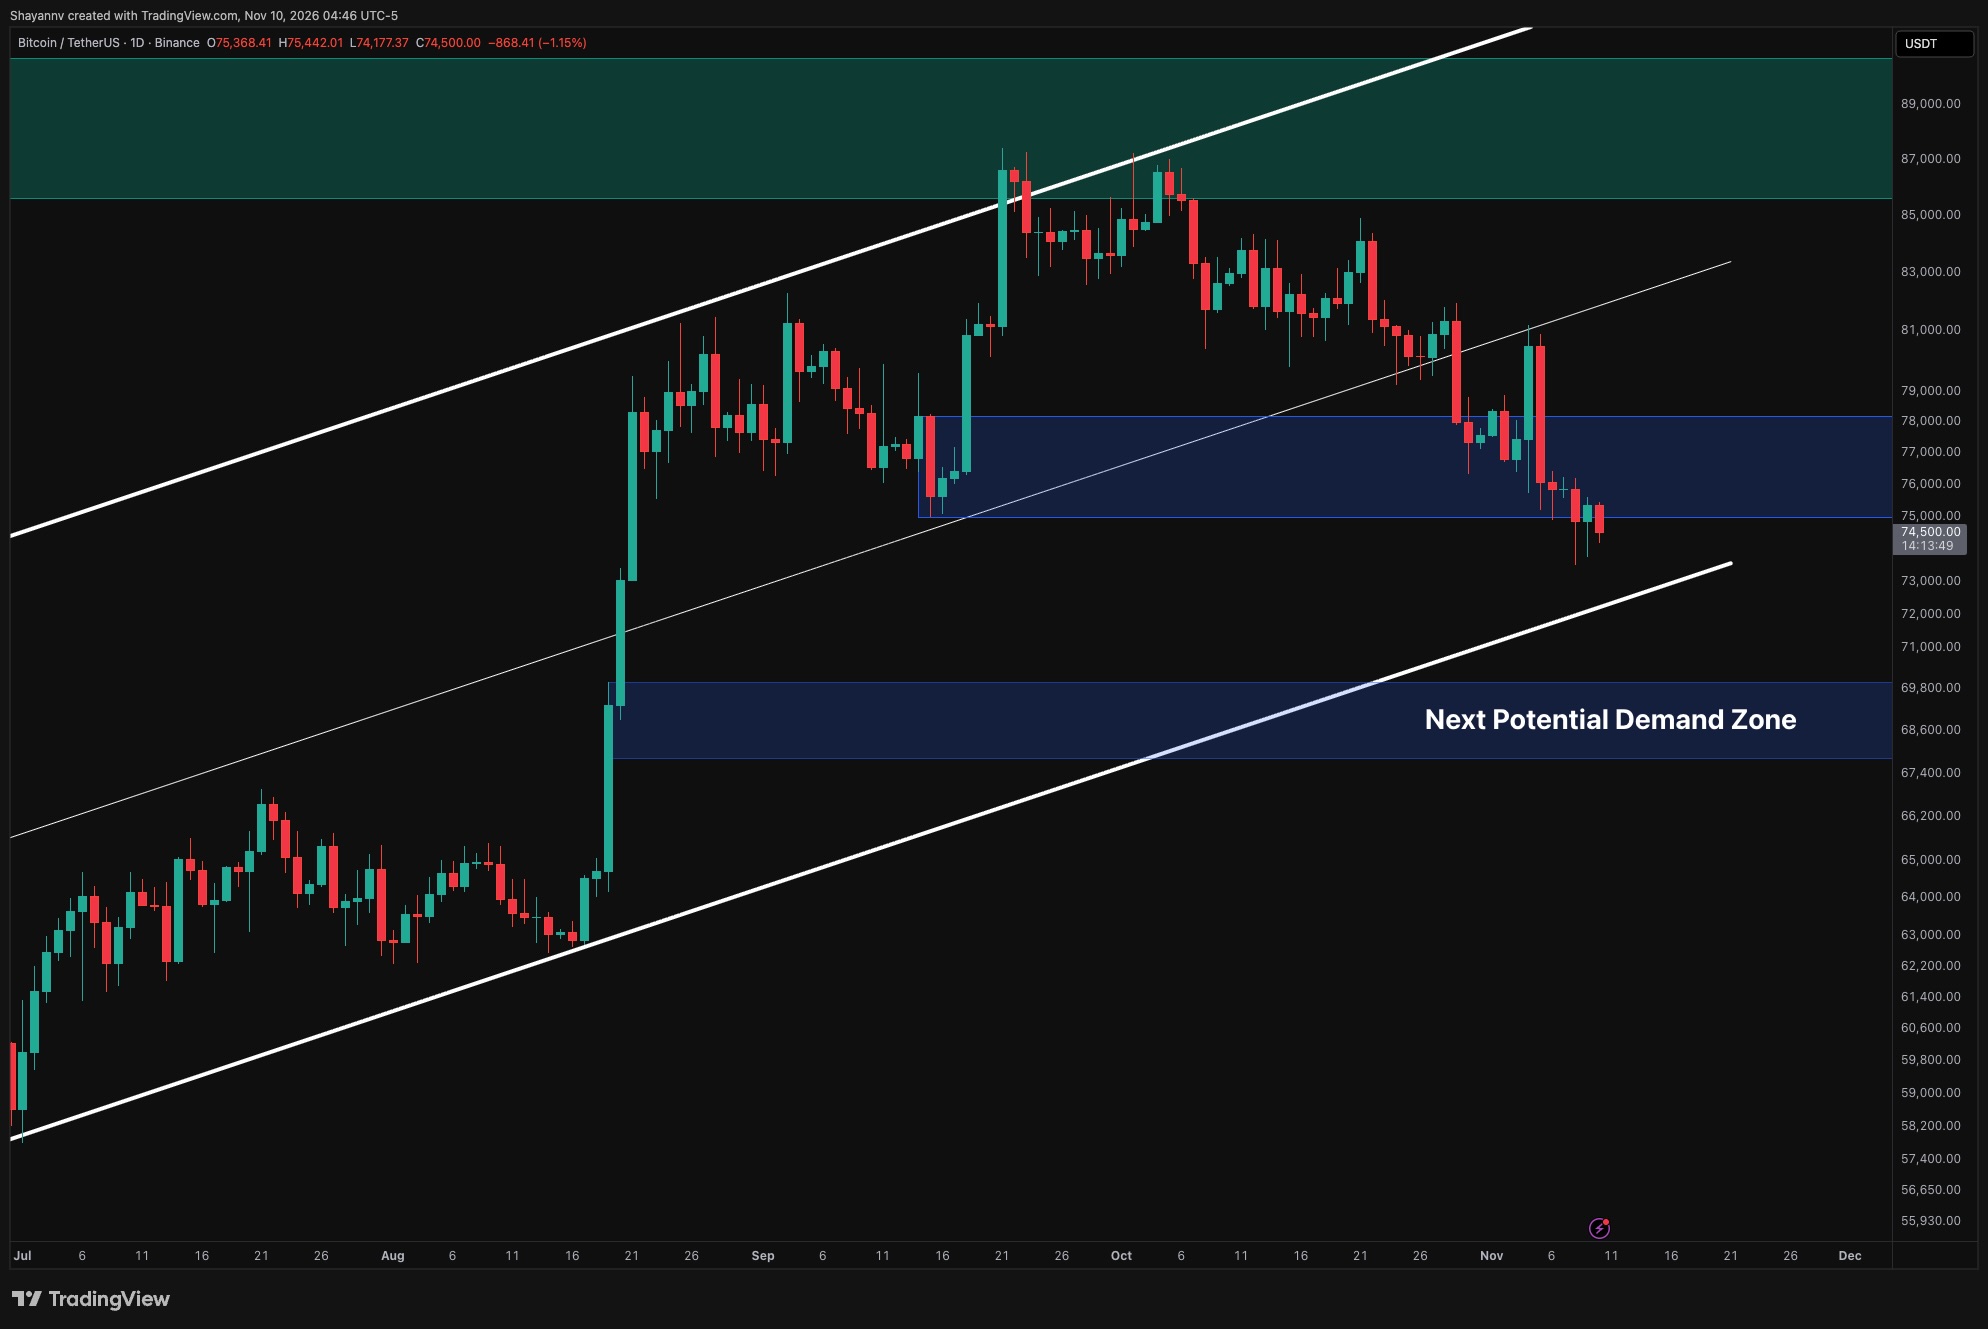
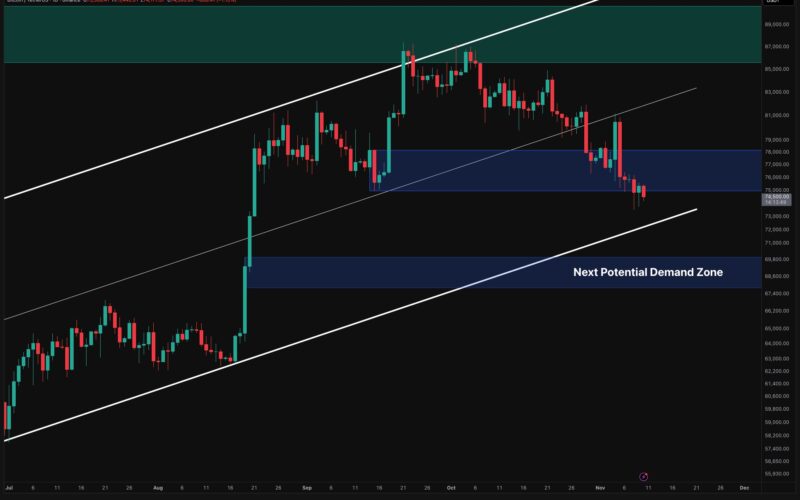
The daily chart shows Bitcoin trading below the lower boundary of the $75K–$78K demand zone following repeated tests. The earlier recovery toward $81K was rejected near the ascending channel’s midpoint, and subsequent rebounds have failed to reverse the sequence of lower highs and lower lows.
Although recent candles show buying interest beneath $74K, the response has been insufficient to reclaim the broken demand zone sustainably. The current daily candle remains open, so confirmation depends on whether Bitcoin closes below $75K or recovers that level before the session ends.
Continued acceptance beneath $75K would leave the ascending channel’s lower boundary, around $73K, as the next important technical reference. A decisive break below that trendline would weaken the broader rising structure and expose the marked $67.8K–$69.8K demand zone, which encompasses part of August’s strong upward expansion.
Alternatively, reclaiming $75K would reduce immediate downside pressure, but buyers would still need to recover $78K to demonstrate a more meaningful improvement.
Until then, rebounds remain vulnerable to selling within the former demand area.
BTC/USDT 4-Hour Chart
The four-hour chart shows Bitcoin breaking beneath both its descending channel’s lower boundary and the recent consolidation base. The marked decision zone around $75.5K–$77K now sits overhead, making it an important test for any recovery.
The initial selloff reached approximately $73.5K before buyers pushed the price back toward $75.5K. However, that bounce failed near the lower edge of the decision zone, and BTC has since returned toward $74.5K. This rejection suggests that former support is beginning to act as resistance.
As long as Bitcoin remains below $75.5K–$77K, another test of the $73.5K low remains plausible. Losing that low would reinforce the bearish continuation scenario and bring the daily channel support around $73K into focus.
Conversely, reclaiming the decision zone would weaken the immediate breakdown and could support a recovery toward the descending channel’s upper boundary around $79K–$80K. The broader $79.8K–$82K supply zone remains a substantial obstacle beyond that initial recovery.

Sentiment Analysis
The Binance liquidation heatmap shows a nearby concentration of estimated long-liquidation exposure around $73K–$73.5K, beneath Bitcoin’s current price. This broadly aligns with the recent low and the approaching daily channel boundary, making it a relevant area if selling continues.
A move through this concentration could trigger forced long closures and amplify short-term volatility. However, the cluster represents potential liquidation exposure rather than confirmed buying demand, so reaching it would not automatically establish a bottom.
Above the market, a prominent concentration sits around $76.5K–$77.5K, overlapping the upper portion of the four-hour decision zone. A successful reclaim of nearby resistance could expose these levels and potentially accelerate a rebound through short liquidations. Larger overhead concentrations remain around $81K–$82K.
For now, the weak price structure keeps the nearby downside cluster in focus. A sustained recovery through $75.5K–$77K would be needed to shift attention toward the more substantial liquidation concentrations above.

Disclaimer: Information found on CryptoPotato is those of writers quoted. It does not represent the opinions of CryptoPotato on whether to buy, sell, or hold any investments. You are advised to conduct your own research before making any investment decisions. Use provided information at your own risk. See Disclaimer for more information.
Source link