Despite showing signs of short-term stabilization above a major support zone, Bitcoin’s downtrend might not be over yet. While momentum has improved on lower timeframes, the broader trend is still tilted to the downside, with price trading below key moving averages and facing heavy overhead resistance.
Meanwhile, on-chain data suggests that large holders may still be distributing coins, adding more fuel to a potential further decline.
Bitcoin Price Analysis: The Daily Chart
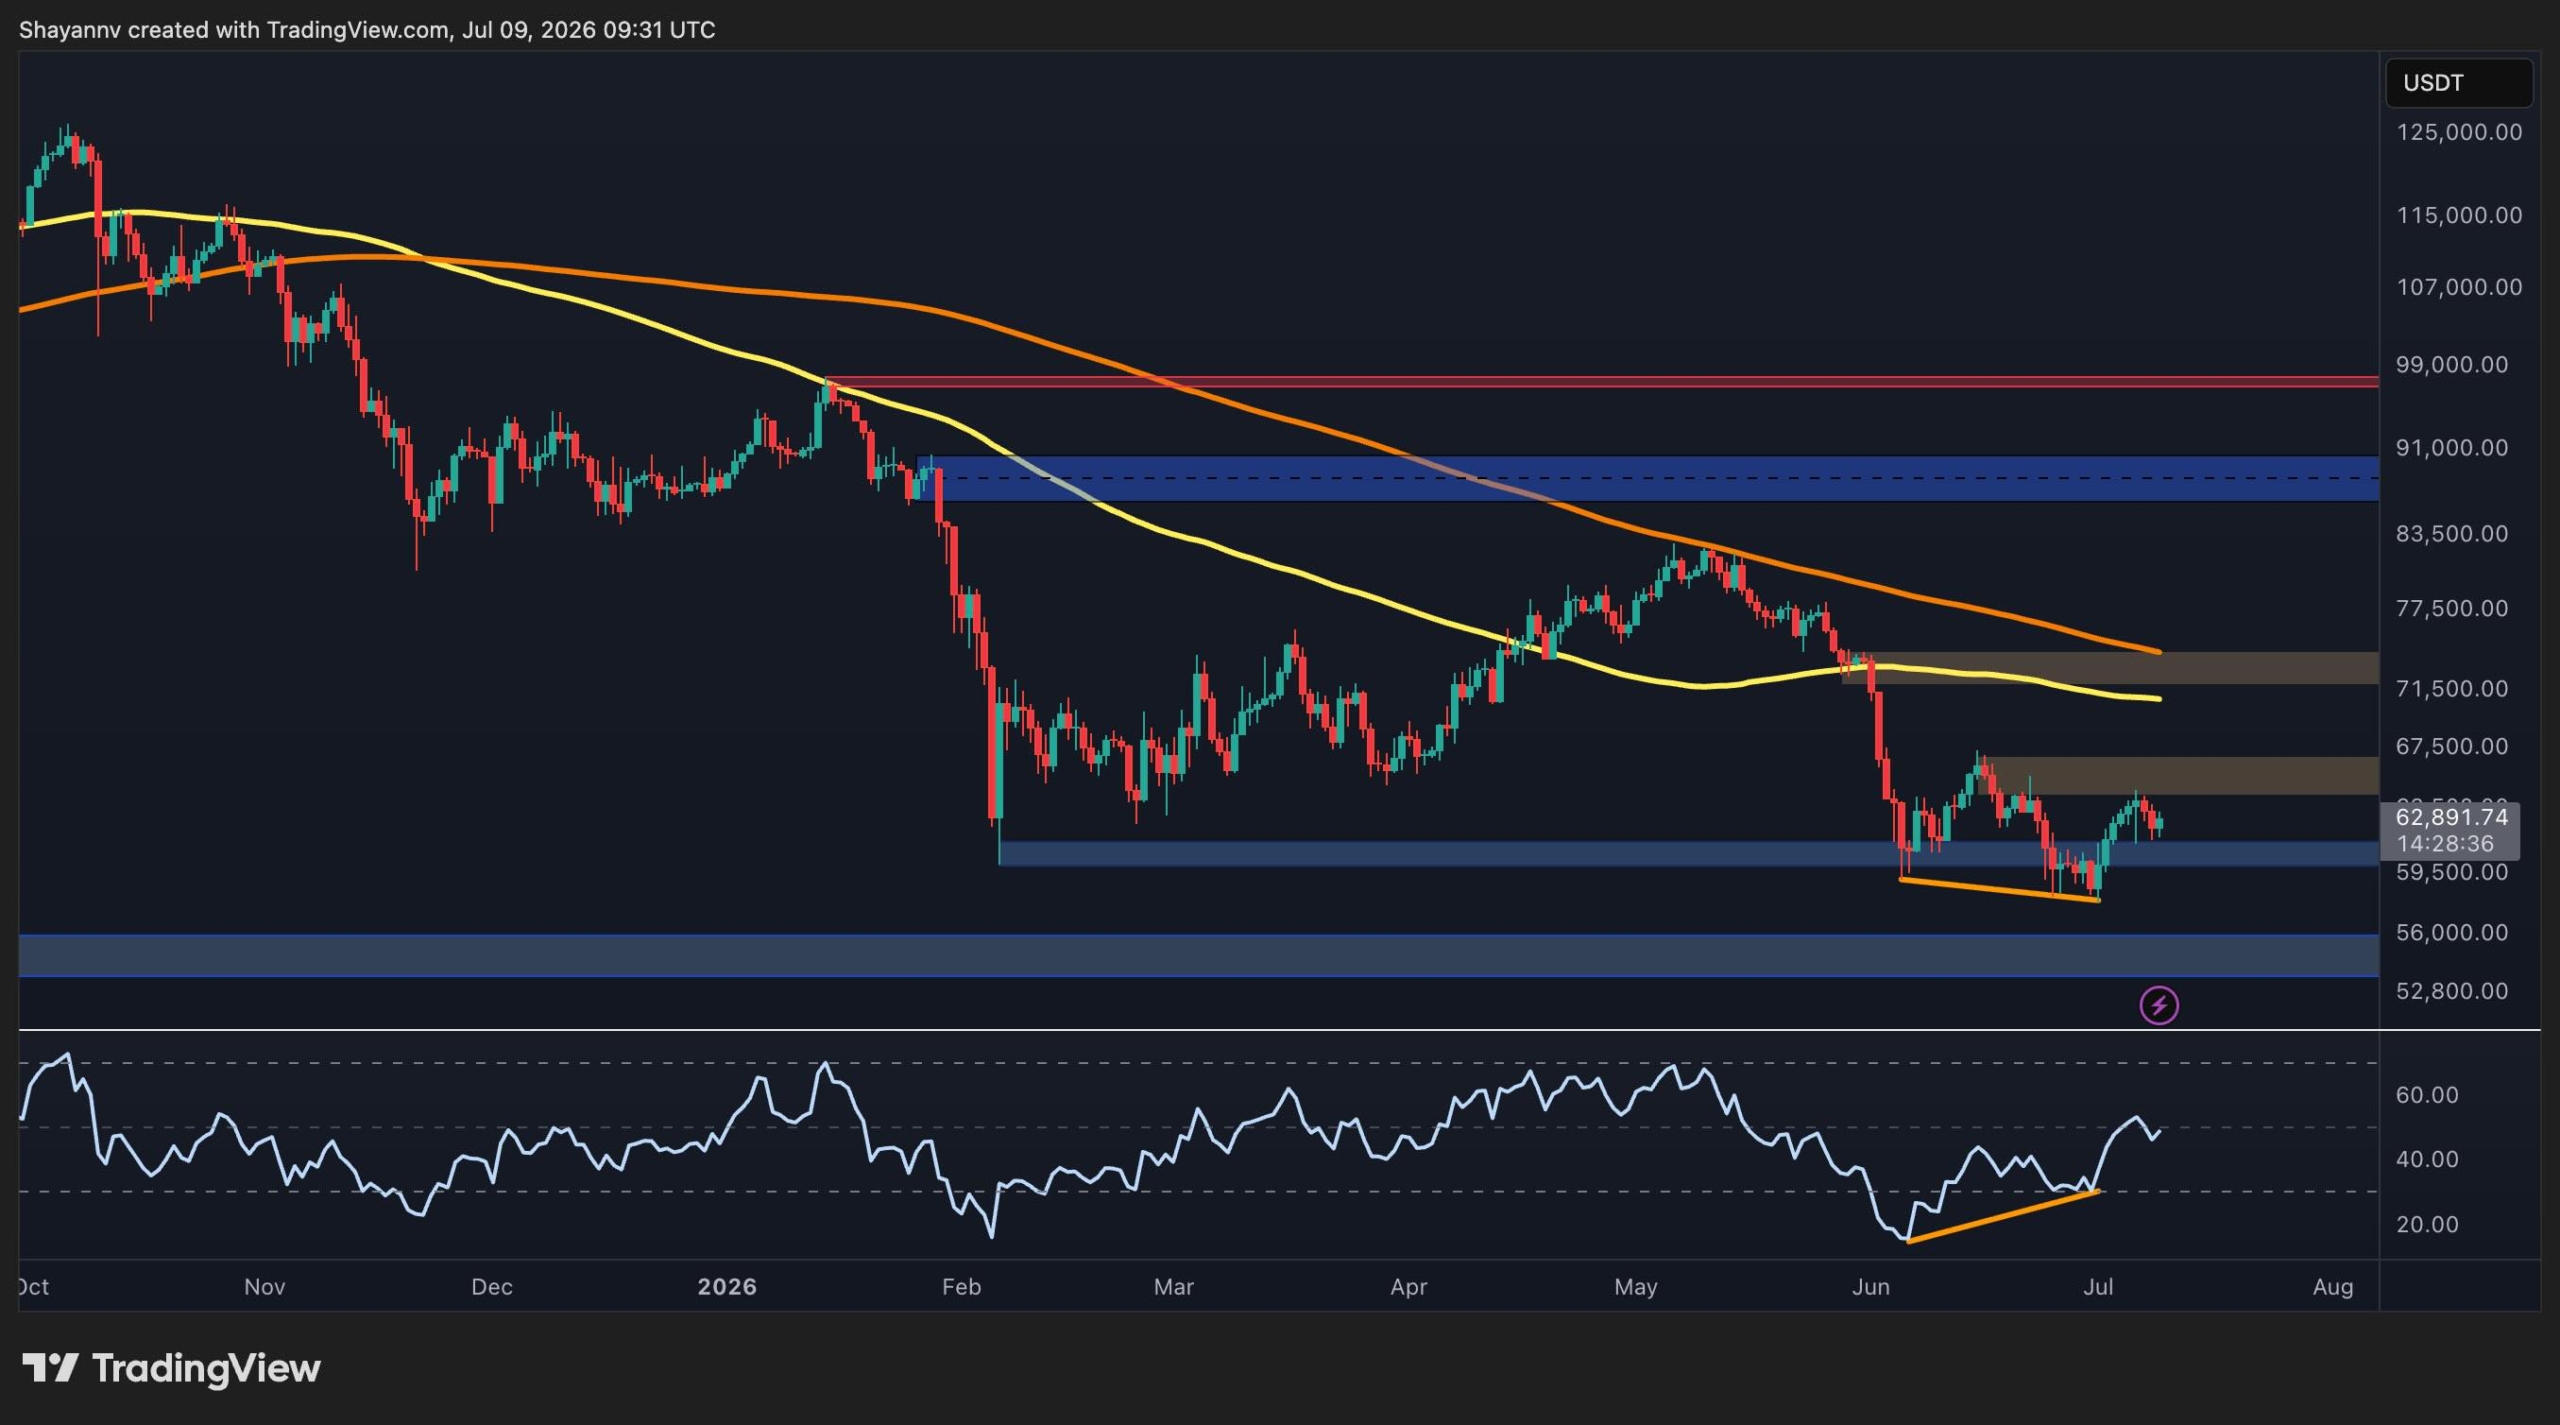
The daily chart shows BTC trading around $64K after bouncing from the $60K support region. That area has once again attracted buyers and prevented a deeper breakdown, while the RSI has formed a higher low from oversold conditions (bullish divergence), signaling improving momentum after the recent sell-off.
Despite the recovery, the broader structure remains bearish. Bitcoin continues to trade beneath both the 100-day and 200-day moving averages, which are sloping downward and currently sit around the $72K region. This creates a significant dynamic resistance zone that aligns with a previous supply area, making it the first major hurdle if buyers extend the recovery.
Above that, a much stronger resistance cluster is located between $88K and $90K, while the major bearish invalidation level remains near $98K. As long as the price stays below these levels, the current rebound appears corrective rather than the beginning of a new impulsive uptrend. On the downside, holding the $60K support remains crucial. Losing this level could expose the next major demand zone around $55K.
BTC/USDT 4-Hour Chart
The 4-hour timeframe paints a more constructive short-term picture. Bitcoin has been trading inside a broad descending channel over the past several weeks and recently rebounded after sweeping liquidity near the lower boundary around $58K.
It has reclaimed the $60K to $62K support area and is attempting to build a sequence of higher lows. The RSI has also recovered just above the 50 level after printing a bullish divergence near the recent bottom, suggesting that selling momentum has weakened in the short term.
However, the market is now approaching an important resistance band between $64K and $66K. This area coincides with the upper portion of the recent consolidation and sits just above the descending channel resistance. A rejection there would keep the broader bearish structure intact and could send BTC back toward the $60K support.
On the other hand, a successful breakout above $66K, especially if accompanied by strong volume, would improve the short-term outlook and increase the probability of a larger recovery toward the $72K to $74K resistance zone.

On-Chain Analysis
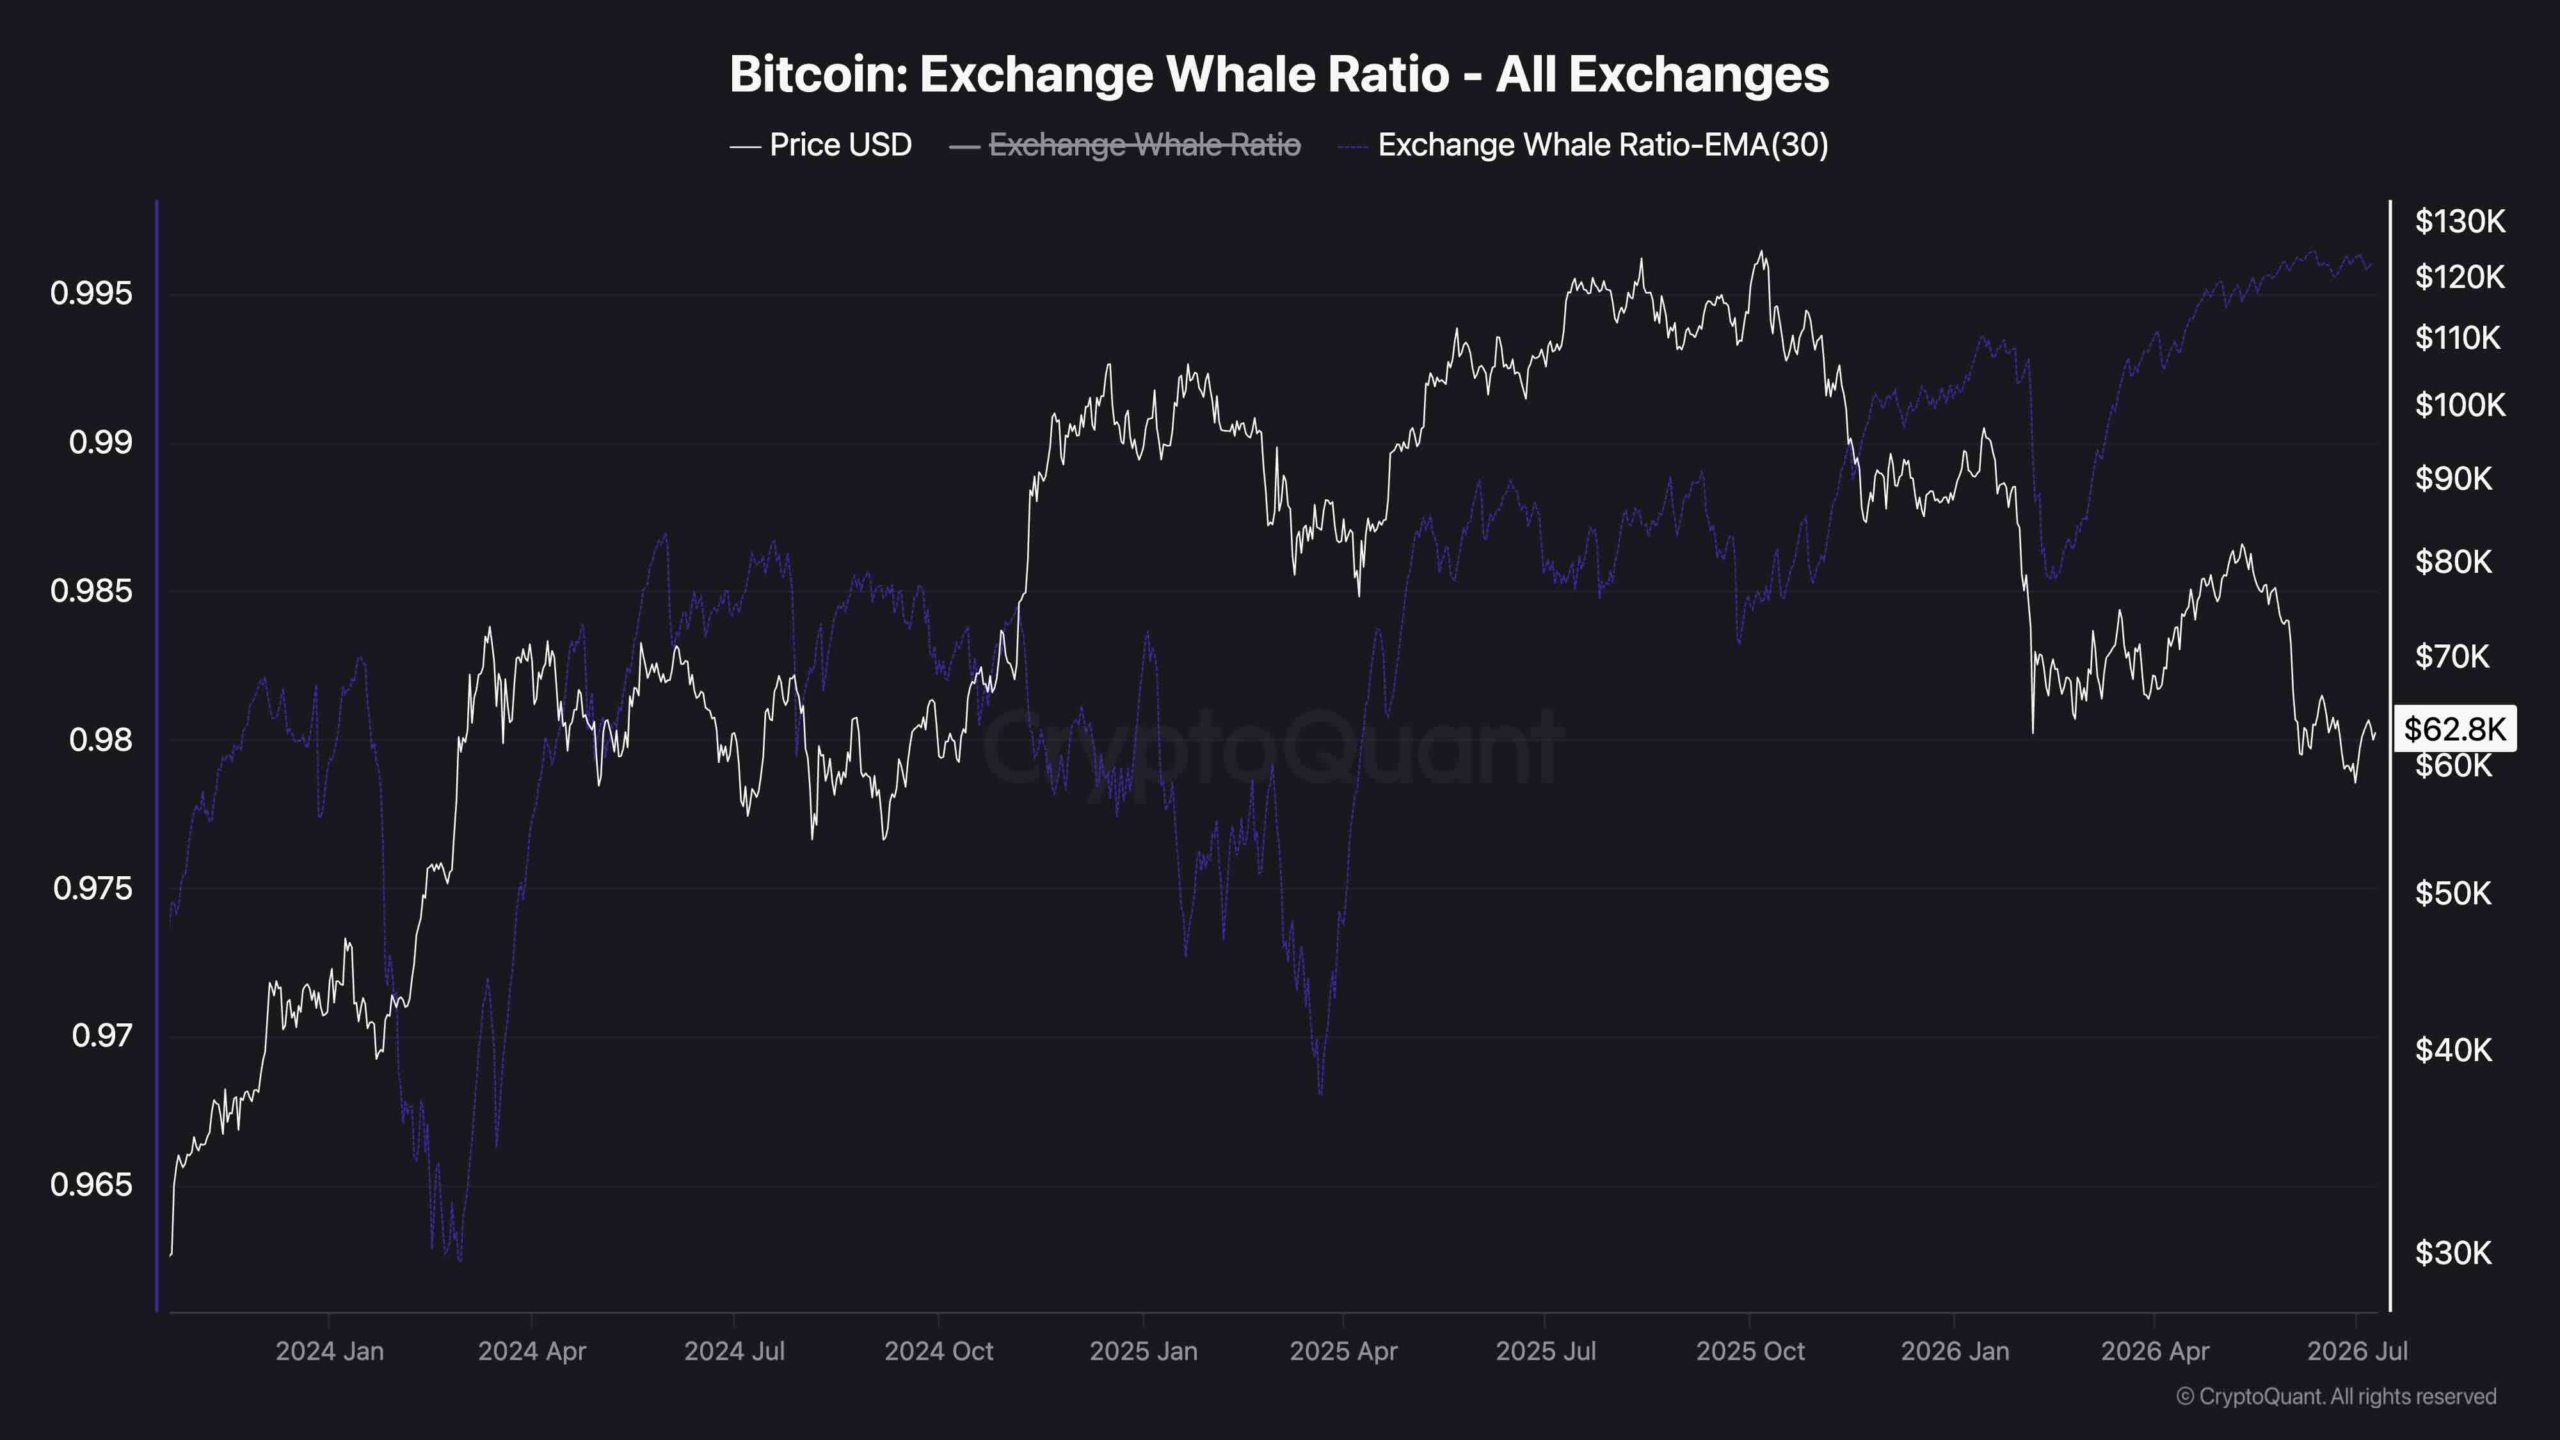
The Exchange Whale Ratio continues to provide a cautious signal. The 30-day exponential moving average of the metric remains elevated, even as Bitcoin is trading near multi-year lows.
A high Exchange Whale Ratio generally indicates that large exchange inflows are dominated by whale-sized transactions, often reflecting increased selling activity or profit-taking from major holders. As the chart suggests, the indicator still remains relatively elevated rather than returning to historically low levels.
Therefore, any recovery toward higher resistance zones could continue to face selling pressure from large market participants unless the metric trends materially lower alongside an improving price structure.
The post Bitcoin Price Analysis: Has BTC Cleared the Danger Zone After $64K Surge? appeared first on CryptoPotato.
Source link