


Bitcoin’s latest SMA crossover mirrors past cycle bottoms, which means that a potential final drop could occur within days.
Continued resistance has kept Bitcoin trading within the $66,000-$68,000 range. As sentiment remains fragile, a technical signal seen in 2014, 2018, and 2022 has reappeared.
However, this could be a major accumulation opportunity for long-term investors.
“Golden Opportunity”
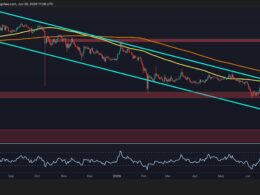
Crypto analyst Ali Martinez has identified a recurring technical signal tied to Bitcoin’s historical cycle bottoms, centered on the crossover between the 50-day and 200-day Simple Moving Averages (SMAs) on the 3-day chart. This crossover has consistently appeared near the final phase of bear markets since 2014, which has led to the last major capitulation before a new bull cycle begins.
During the 2014 cycle, Bitcoin had already fallen 72% from its peak when the crossover formed in December, followed by a further 52% decline within 23 days that marked the ultimate bottom. In 2018 as well, the pattern repeated after a 67% drawdown, with the crossover appearing in November and a final 50% drop occurring 33 days later.
The 2022 cycle also showed a similar structure, as a 50% decline preceded the crossover in May and an additional 45% drop within 33 days, although a secondary lower low formed 156 days later, which completed the broader bear market structure. In the current cycle, following the October 2025 peak, Bitcoin has already recorded a 52% correction, and the SMA crossover appeared on February 27, 2026.
As of now, roughly 30 days have passed since this signal emerged, which places the market within the historical window where previous cycles experienced their final leg down. Martinez observed that if historical patterns continue to hold, Bitcoin could be entering what he describes as the “final accumulation window” within a matter of days.
Based on prior post-crossover declines ranging between 40% and 50%, he identifies potential accumulation zones around $40,000, which represents a more moderate reset, and a deeper washout scenario of $30,000. While the signal does not guarantee a further decline, in previous instances, it has coincided with the last significant downward move before the formation of a long-term macro bottom and the transition into a new bull market phase.
You may also like:
Bear Market Targets
Extending the downside outlook, on-chain analyst Willy Woo estimated that Bitcoin could bottom between $46,000 and $54,000 based on legacy valuation models. The CVDD Floor, currently near $45,500, continues to rise and acts as a support benchmark. He also found that capital flowing into Bitcoin has been declining since November amid weakening demand. These models are based on a small number of past bear markets that occurred under favorable macro conditions. As such, a weaker global backdrop could push the crypto asset below these projected levels.
A deeper downside range has been predicted by Doctor Profit, who placed the likely bottom between $35,000 and $45,000. He stated that the market has not yet reached its cycle low. Short-term upside toward the $79,000 to $84,000 range remains possible. However, such moves are viewed as temporary and more suitable for short positioning.
Binance Free $600 (CryptoPotato Exclusive): Use this link to register a new account and receive $600 exclusive welcome offer on Binance (full details).
LIMITED OFFER for CryptoPotato readers at Bybit: Use this link to register and open a $500 FREE position on any coin!
Source link