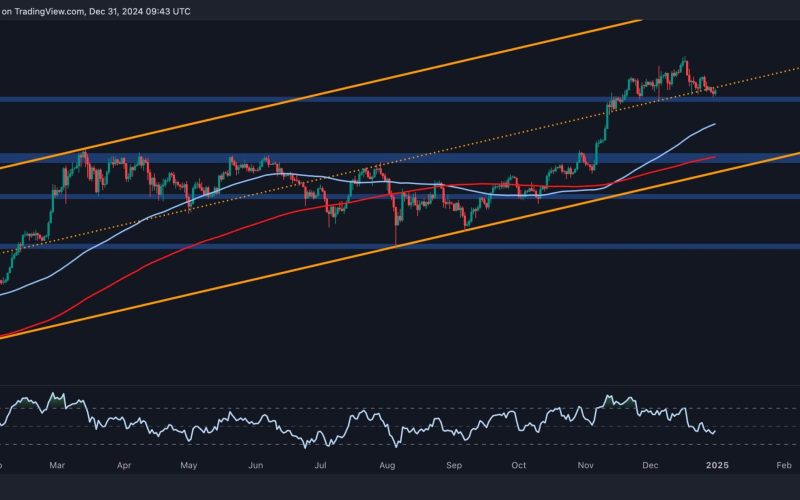
Bitcoin is struggling with the midline of its prolonged ascending channel around the $92K mark, teetering on the edge of a potential breakdown.
Despite this, the cryptocurrency has several key support levels ahead, fueling optimism for a possible bullish recovery in the near future.
Technical Analysis
By Shayan
The Daily Chart
Bitcoin has recently faced a notable correction, with the price currently stabilizing at the ascending channel’s middle trendline near the $92K mark. This level acts as a critical support zone, historically representing a significant area of demand. Despite this support, sellers have exerted considerable pressure, threatening to break below this key threshold.
In the event of a successful breach, Bitcoin could experience a cascade of long liquidations, potentially driving the price downward toward the 100-day moving average of $81K. This MA represents a robust dynamic support, likely to attract substantial buying interest and mitigate further downside momentum. Conversely, a rebound at the current level could see Bitcoin regain bullish momentum, aiming to retest the $108K upper boundary of the channel in the mid-term.
The 4-Hour Chart
On the lower timeframe, Bitcoin has breached the middle trendline of its multi-month ascending channel, signaling increased distribution among participants. This bearish development coincides with growing market uncertainty as investors anticipate potential volatility surrounding President Trump’s inauguration on January 20, 2025.
Currently, Bitcoin hovers near a critical support range defined by the $90K threshold and the Fibonacci retracement levels at 0.5 ($87K) and 0.618 ($82K). This region is a formidable barrier to further selling pressure and is expected to trigger a market reversal.
On-chain Analysis
By Shayan
Bitcoin market participants remain uncertain about the continuation of the bullish trend, with speculation revolving around whether higher prices are imminent or if the rally has concluded. A critical on-chain metric providing insight into this behavior is the realized price UTXO age bands, particularly for the 1-3 month (short-term) cohort.
The realized price for this cohort acts as a dynamic threshold, reflecting the average price at which these recent buyers acquired their holdings. When BTC sustains above this realized price, it signals growing bullish momentum, indicating that new buyers are confident enough to hold despite elevated levels. On the contrary, a price drop below this threshold suggests a heightened risk of a sell-off, as these participants enter loss territory and may resort to panic selling, increasing downward pressure on the market.
Currently, the realized price of the 1-3 month cohort resides at the $81K region, marking it as a critical support zone. This level is viewed as the primary defense line for buyers in the long-term outlook, with its ability to hold likely determining the broader market’s direction.
Binance Free $600 (CryptoPotato Exclusive): Use this link to register a new account and receive $600 exclusive welcome offer on Binance (full details).
LIMITED OFFER for CryptoPotato readers at Bybit: Use this link to register and open a $500 FREE position on any coin!
Disclaimer: Information found on CryptoPotato is those of writers quoted. It does not represent the opinions of CryptoPotato on whether to buy, sell, or hold any investments. You are advised to conduct your own research before making any investment decisions. Use provided information at your own risk. See Disclaimer for more information.
Cryptocurrency charts by TradingView.
Source link


