


Ethereum is trading around $2,460 as it holds near its highest levels since the February breakdown, with the broader crypto market continuing to recover. ETH is now pressing against one of the most technically significant zones of the entire correction.
How the price behaves over the next several sessions will go a long way toward determining whether this rally has genuine legs or simply represents another failed attempt at trend reversal.
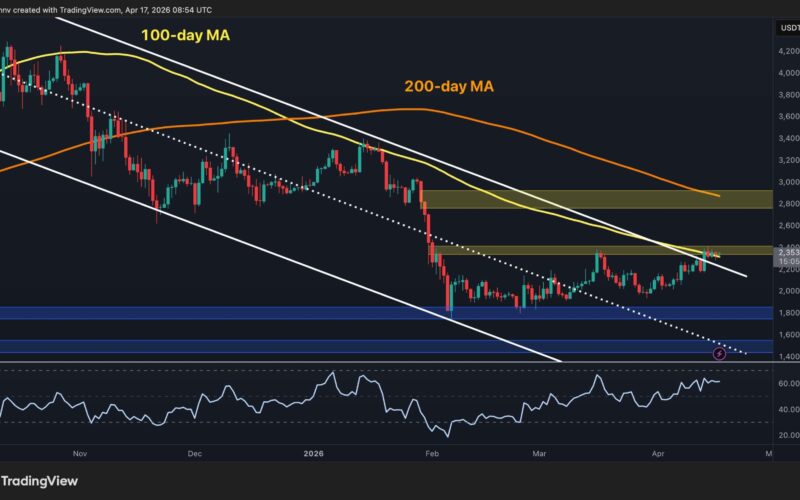
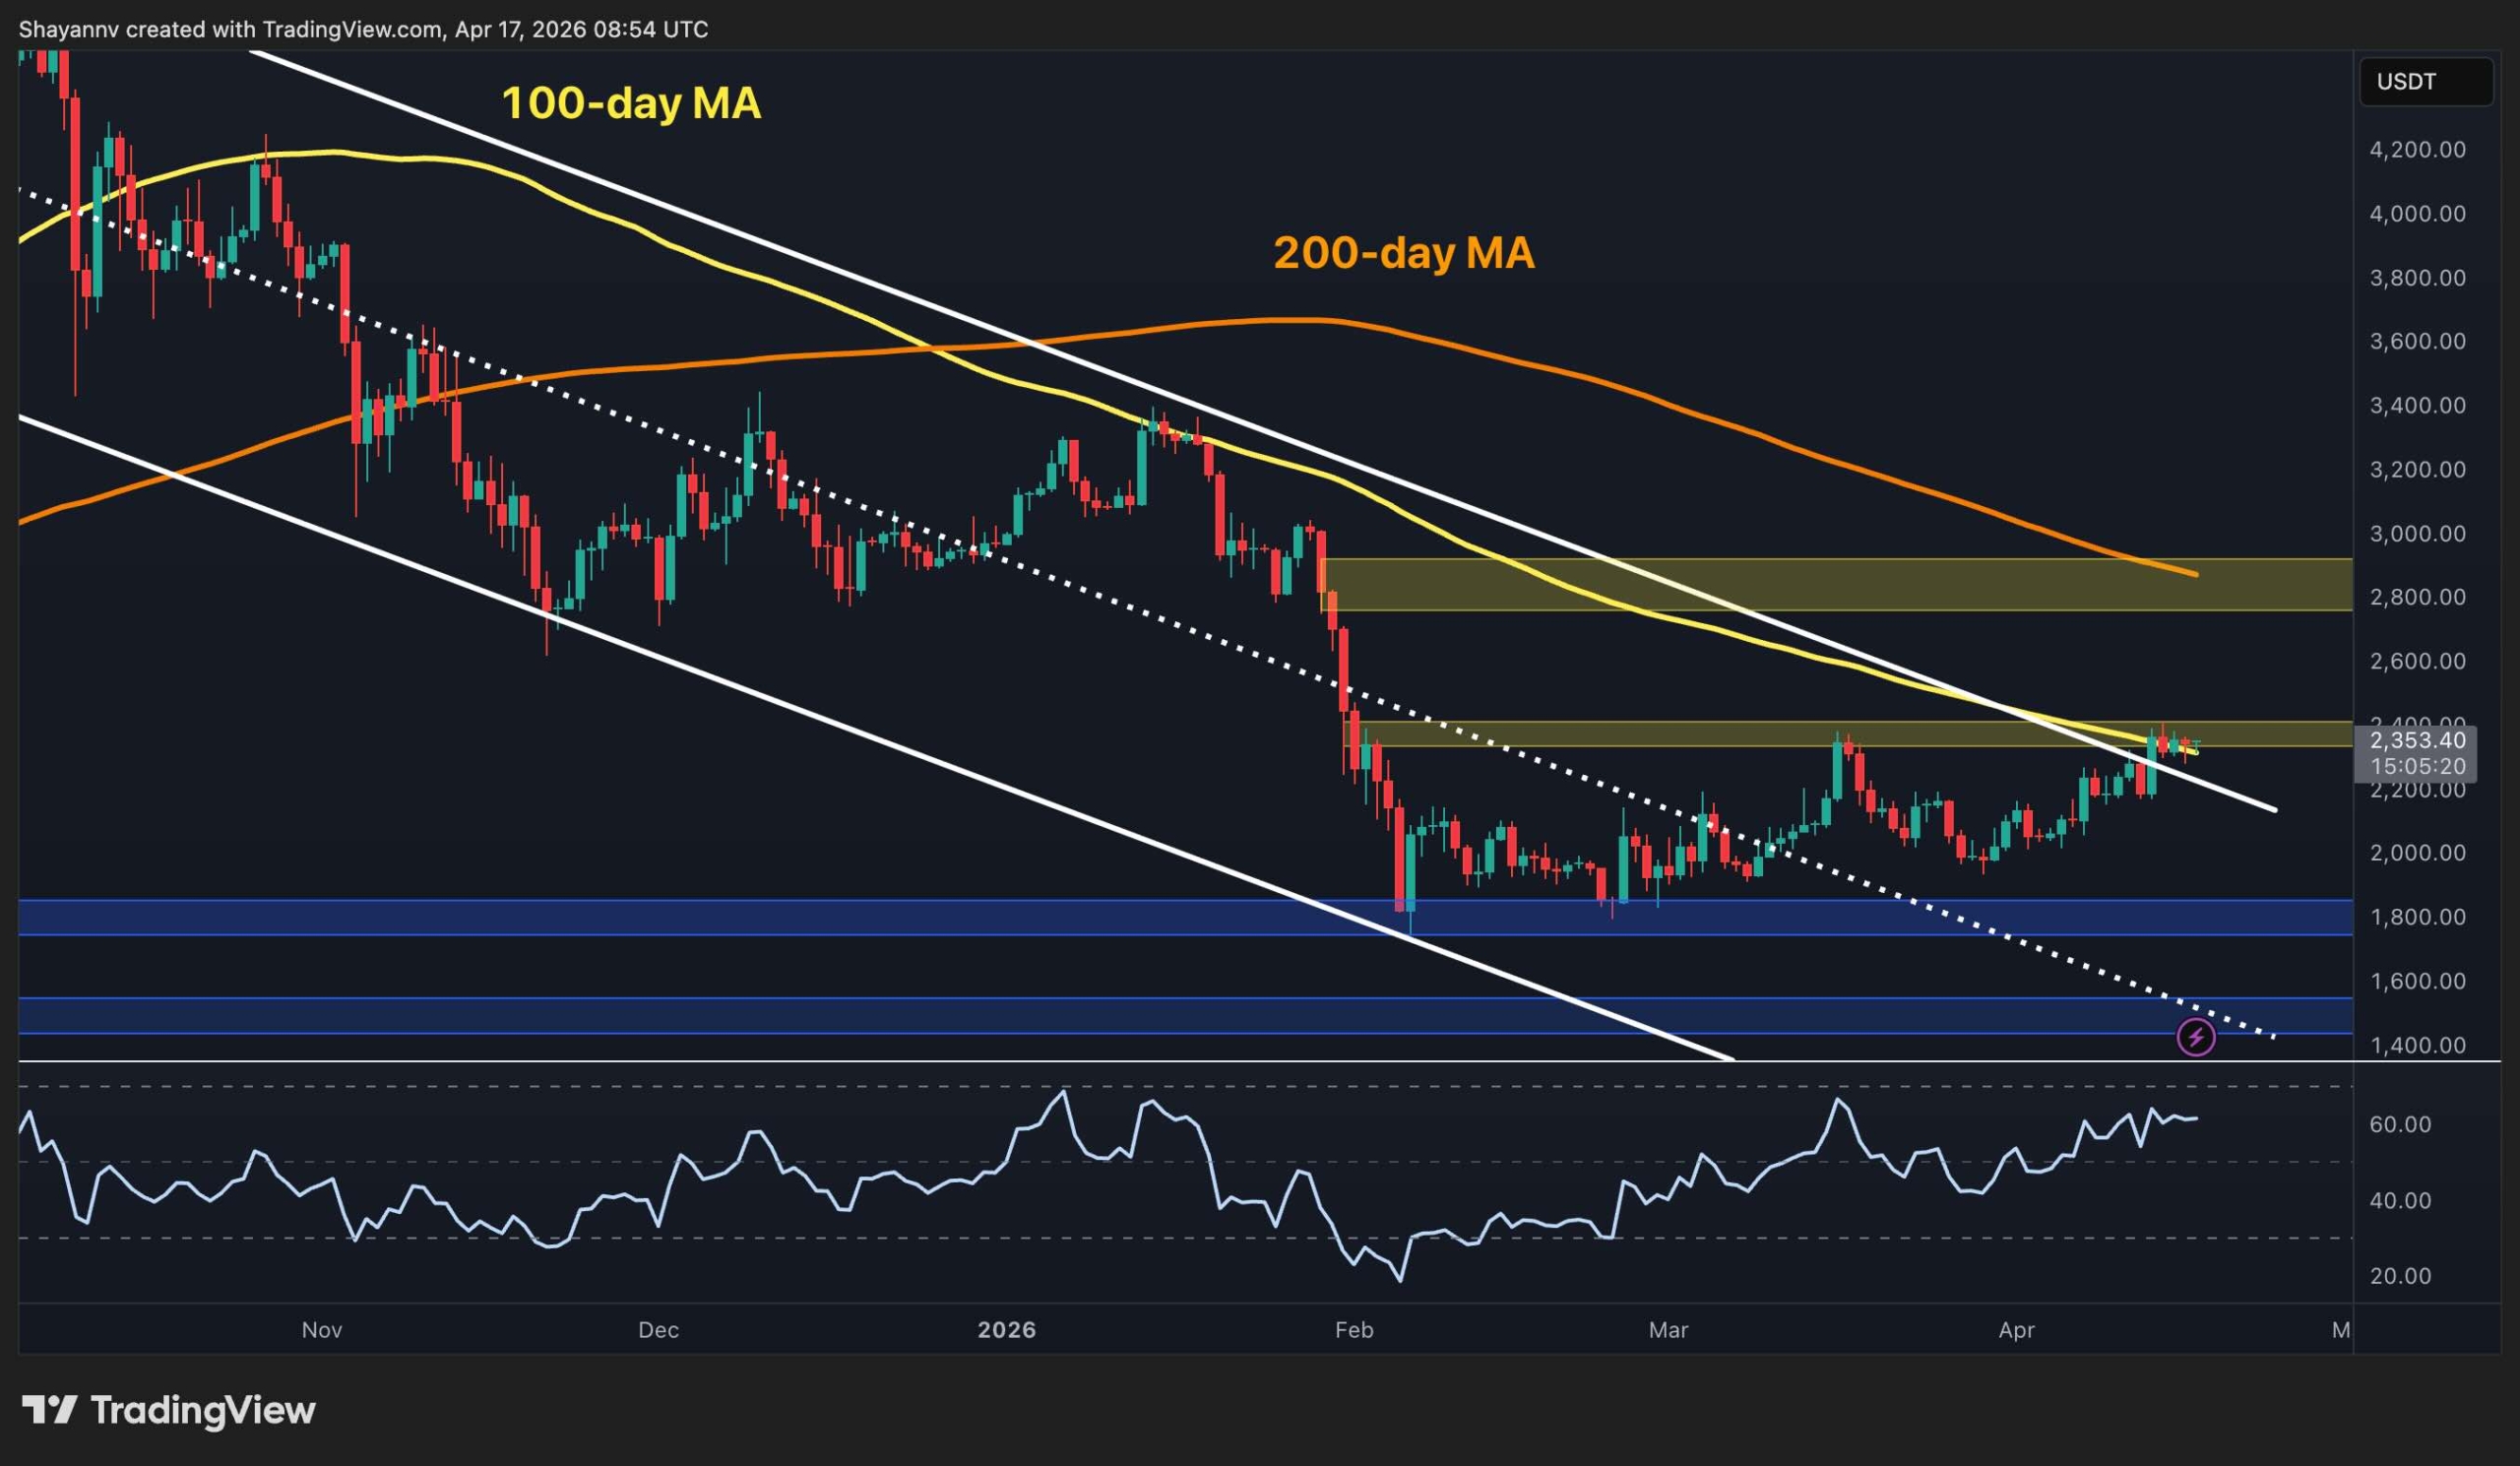
Ethereum Price Analysis: The Daily Chart
ETH has broken slightly above the long-term descending channel’s upper boundary on the daily chart and is now testing the 100-day MA near and the horizontal $2.4k supply zone. This is a very important level that has stood firmly over the past couple of months. The RSI has also climbed into the high-50s and is trending upward. This indicates that momentum supports the breakout attempt and is not flashing an overextended signal yet.
The key test now is whether ETH can convert this into a valid breakout above the $2.4k level and the 100-day moving average. The $2.8k zone above represents the next major supply corridor, with the declining 200-day MA (~$2.9k) located at its upper boundary.
A daily candle close above $2.4k would be the most bullish development in months, and could pave the way toward $2.8k. On the other hand, if the market fails to continue higher, a drop back inside the descending channel would be likely, which could then result in another decline toward the $1.8k critical support area.
ETH/USDT 4-Hour Chart
On the 4-hour chart, ETH has been grinding just below the $2.3k–$2.4k resistance band for the past several sessions. Meanwhile, the ascending trendline from the February lows continues to provide a rising floor, which is currently located near the $2k mark. The most recent push briefly broke above the $2.4k level before pulling back modestly, and the price is currently consolidating above $2.4k, which is directly inside the resistance zone.
The RSI on this timeframe is also hovering in the mid-60s, which is elevated but not overbought, but has pulled back from overbought levels in recent days. The pattern of steep higher lows on the 4-hour chart since early April is also constructive and contrasts with the repeated failed recoveries seen in March. Therefore, all eyes are now on the $2.4k resistance zone, which a breakout from would indicate that Ethereum is serious in its recovery.

Sentiment Analysis
The 30-day moving average of the Ethereum Taker Buy/Sell Ratio has spiked to approximately 1.02, which is the highest reading in the entire dataset stretching back to mid-2023. This metric has been showing values below 1 for the majority of the past 3 years, and current readings indicate that aggressive market buyers are now significantly outpacing sellers in the futures market. The timing of this surge, coinciding with ETH’s push toward the $2.3k–$2.4k resistance zone, suggests the recent price action is being driven by genuine futures market demand rather than a passive drift higher.
Historically, rising taker buy/sell ratios have accompanied the early stages of meaningful price advances, as seen at the beginning of previous price rallies. The current reading is particularly notable because it finally represents a clear shift in futures market behavior.
That said, a ratio this elevated can also precede short-term exhaustion if the price fails to follow through above key resistance, which makes the $2.4k level the immediate litmus test for whether the current demand surge translates into a sustained trend change or simply another episode of aggressive buying turning into a long liquidation cascade shortly afterward.

Binance Free $600 (CryptoPotato Exclusive): Use this link to register a new account and receive $600 exclusive welcome offer on Binance (full details).
LIMITED OFFER for CryptoPotato readers at Bybit: Use this link to register and open a $500 FREE position on any coin!
Disclaimer: Information found on CryptoPotato is those of writers quoted. It does not represent the opinions of CryptoPotato on whether to buy, sell, or hold any investments. You are advised to conduct your own research before making any investment decisions. Use provided information at your own risk. See Disclaimer for more information.
Source link


