


Bitcoin is trading around $72.4k as markets digest a turbulent start to Q2, with macro uncertainty and a shaky ceasefire in the Middle East continuing to weigh on risk assets globally. While BTC has shown some resilience relative to traditional markets in recent weeks, the broader technical structure remains bearish, and the road to recovery is still paved with significant resistance overhead.
Bitcoin Price Analysis: The Daily Chart
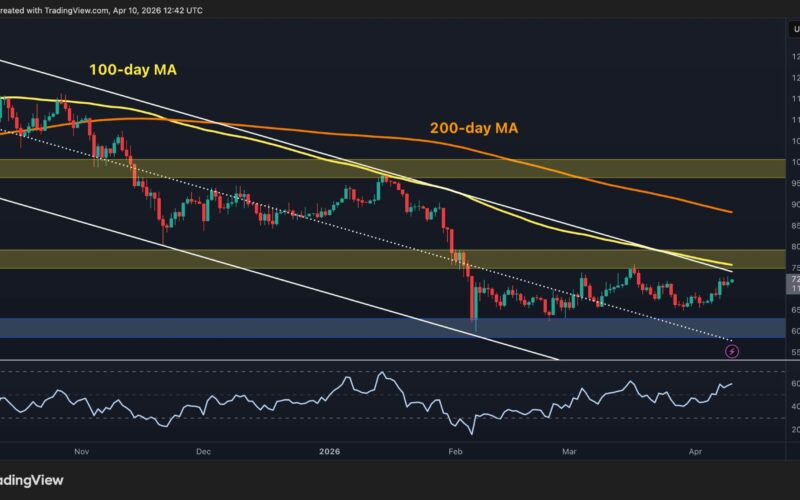
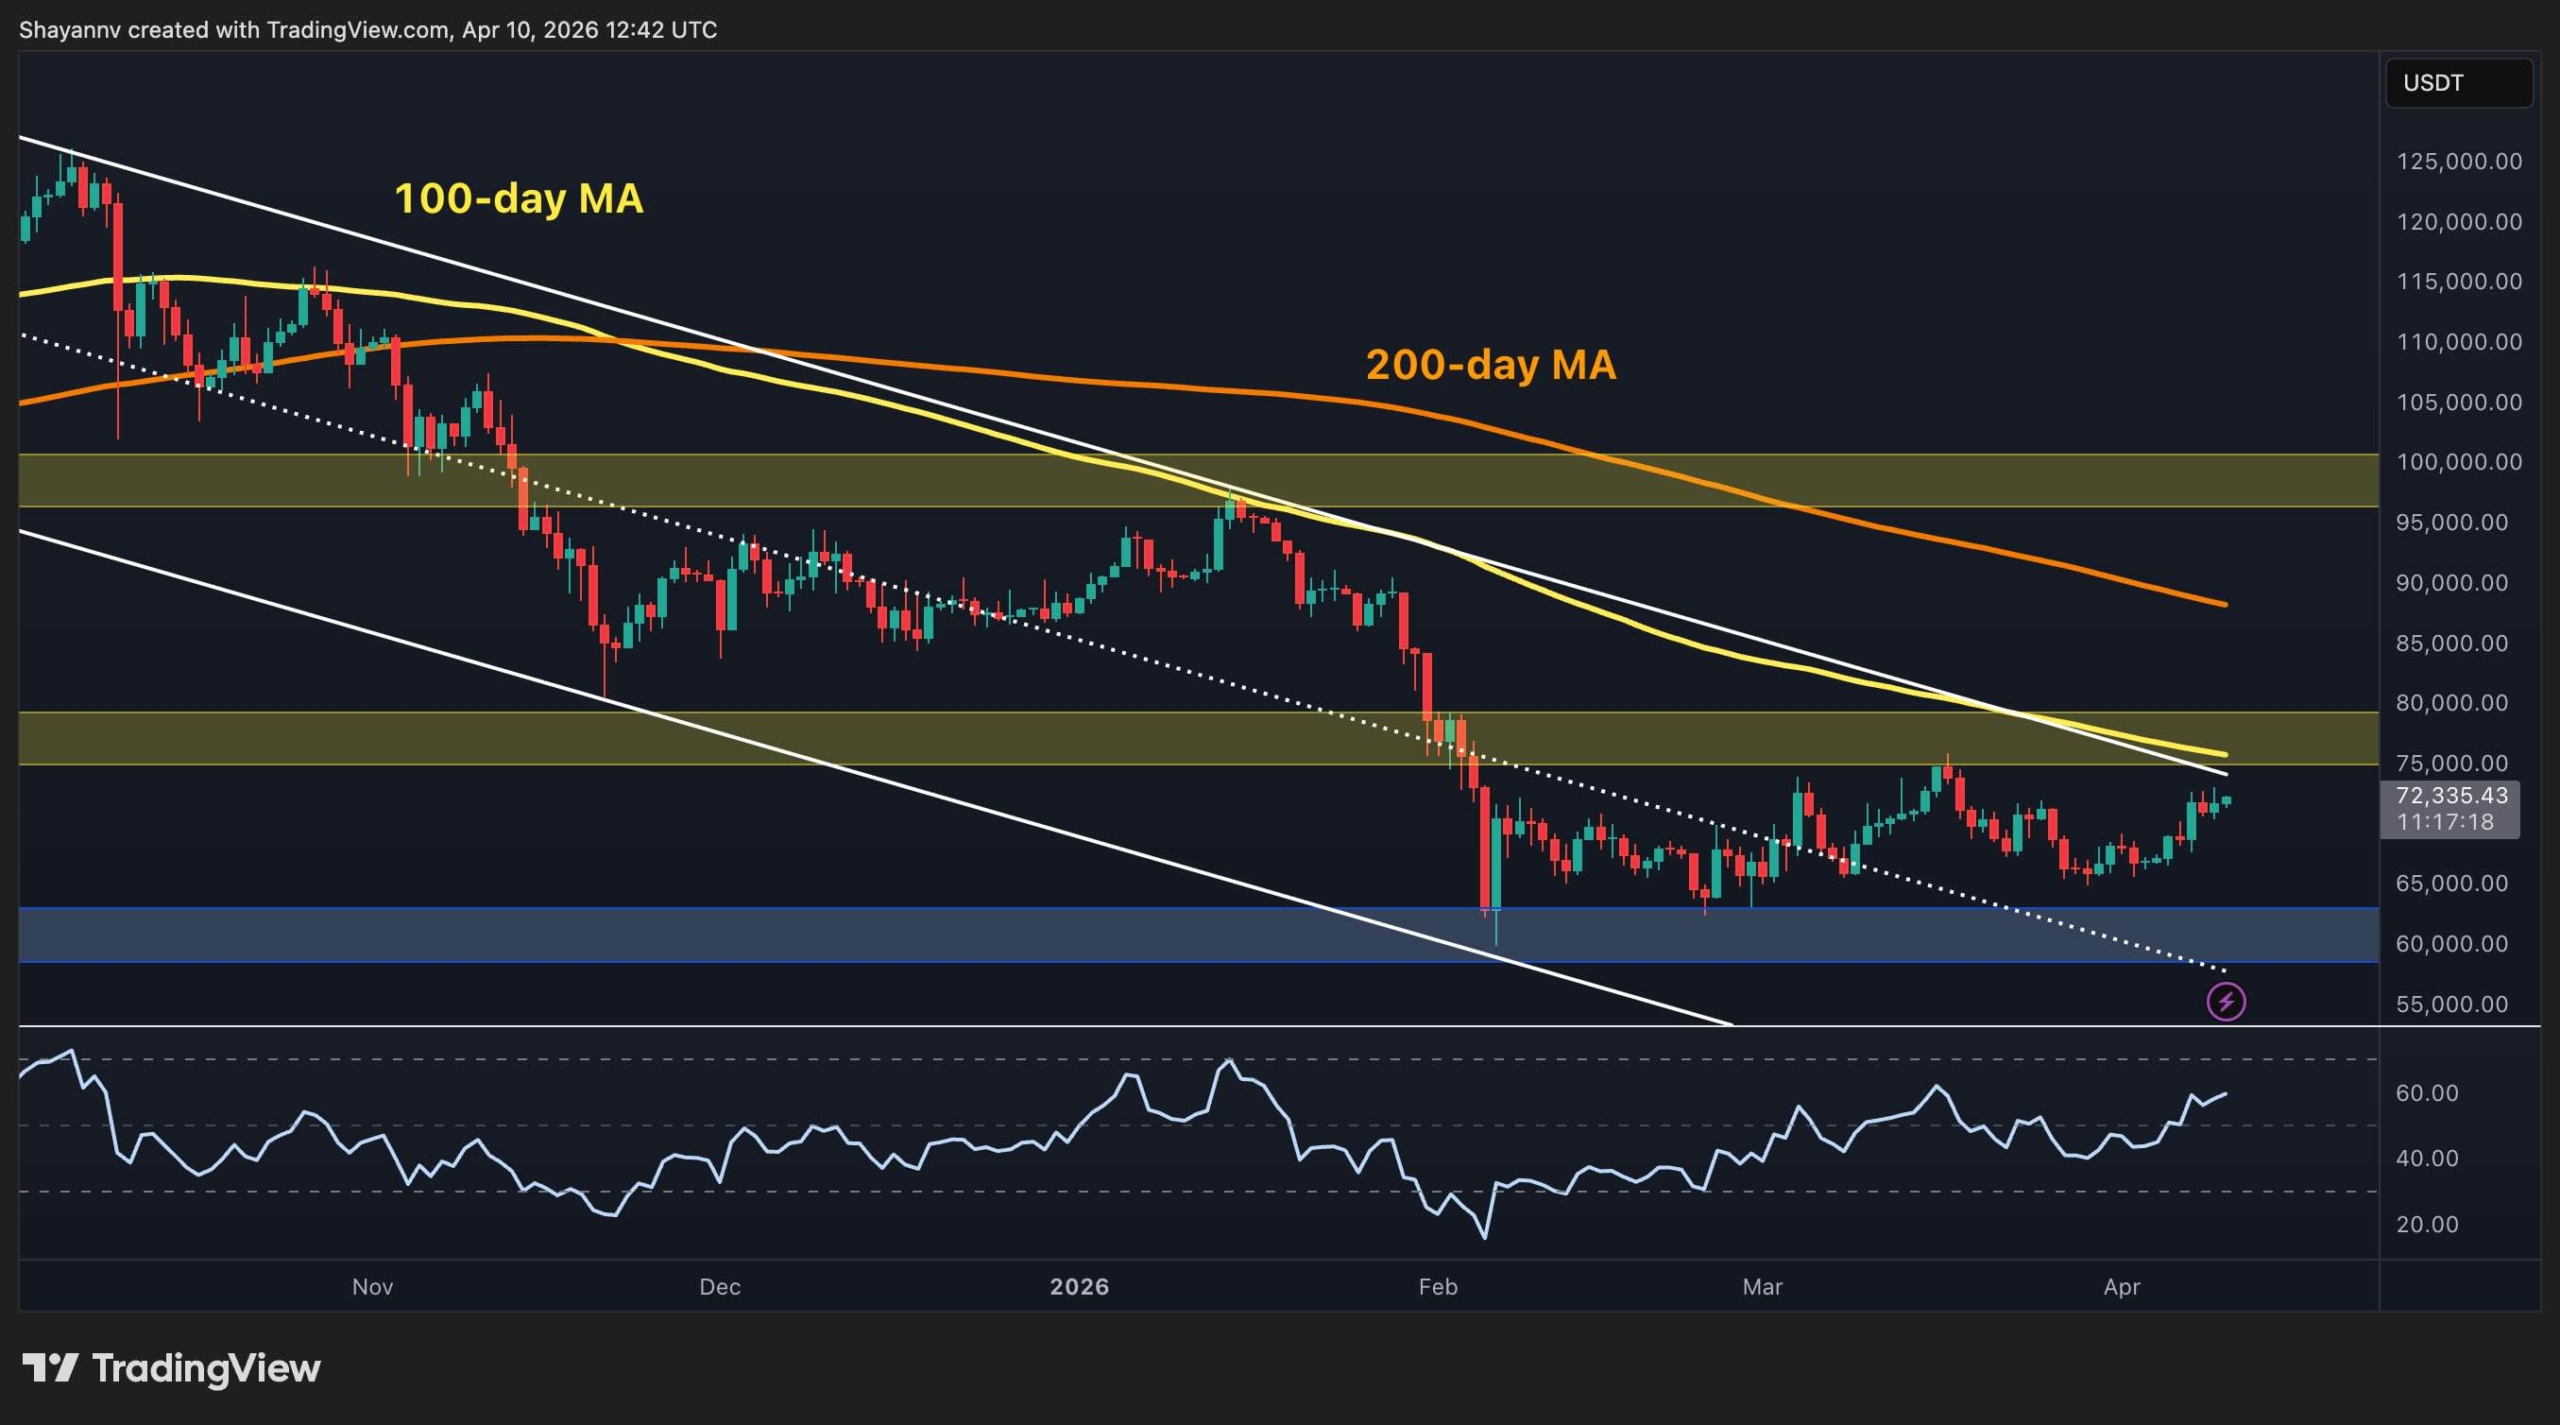
The descending channel on the daily chart continues to govern price action. The 100-day MA (~$75k) and 200-day MA (~$87k) are both declining and sitting above the current price, and acting as potential dynamic resistance levels. Meanwhile, the static $75k–$80k zone still remains the key resistance band that has held the price once before in March, and the channel’s upper boundary is also located near this area, making it an even more formidable ceiling.
That said, the RSI has been trending upward since the March lows and is now approaching the 60s. This is the most constructive daily momentum reading since before the February crash. The key support level at $60k continues to hold, and a push through $75k and above the 100-day moving average on strong volume would be the first genuine sign that the trend is shifting.
BTC/USDT 4-Hour Chart
On the 4-hour timeframe, BTC has been compressing inside a slightly ascending channel since the February lows, with the pattern defined clearly with the higher highs and lows formed during this period. The asset is currently at $72.4k, sitting at the middle of the channel, and the RSI is hovering just below the overbought zone, which points to the fact that the bullish momentum is strong but not too strong yet.
The nearby $74k–$76k resistance zone would be the first obstacle the market needs to clear if a bullish continuation happens. A confirmed close above this area would be a significant short-term uptrend signal and could accelerate a move toward the higher boundary of the channel located near the $80k resistance band. On the downside, the channel’s lower trendline near $66k–$67k and the $60k supply zone remain the levels to defend for the buyers.
Until a breakout from either of the immediate support and resistance levels, predicting a direction based on technical analysis will be too risky, as the geopolitical and macroeconomic threats are more significant than they have been for a long time.

Sentiment Analysis
The Futures Retail Activity indicator is flashing one of the more interesting signals seen in this correction cycle. After a brief cluster of “Few Retail” green dots appeared near the $85k–$90k range in late 2025 — historically a bullish signal indicating under-participation — the current reading has shifted to a large “Many Retail” cluster right at current prices around $65k–$72k. The size of these dots suggests a significant surge in retail futures activity, likely for speculation.
Historically, elevated retail speculative participation in futures has tended to appear in the middle of a trend, indicating that BTC could still visit lower prices to flush these participants out and cool off the current environment. Combined with the fact that the price is trading around a major resistance zone, this sentiment signal suggests that investors should still be cautious, and that a sustained recovery might not be on the cards yet.

The post Bitcoin Price Prediction: Has BTC Weathered the Storm by Surging to $72K? appeared first on CryptoPotato.
Source link


