


Ethereum has entered an aggressive deleveraging phase, breaking decisively lower after weeks of distribution near the upper boundary of its medium-term range. A key macro driver behind this move appears to be the recent escalation of geopolitical tensions in the Middle East, which has pushed broader risk assets into de-risking mode and amplified existing technical fragilities in the ETH market.
The combination of macro uncertainty, elevated leverage, and vulnerable chart structure has produced a sharp unwind rather than a controlled pullback.
Ethereum Price Analysis: The Daily Chart
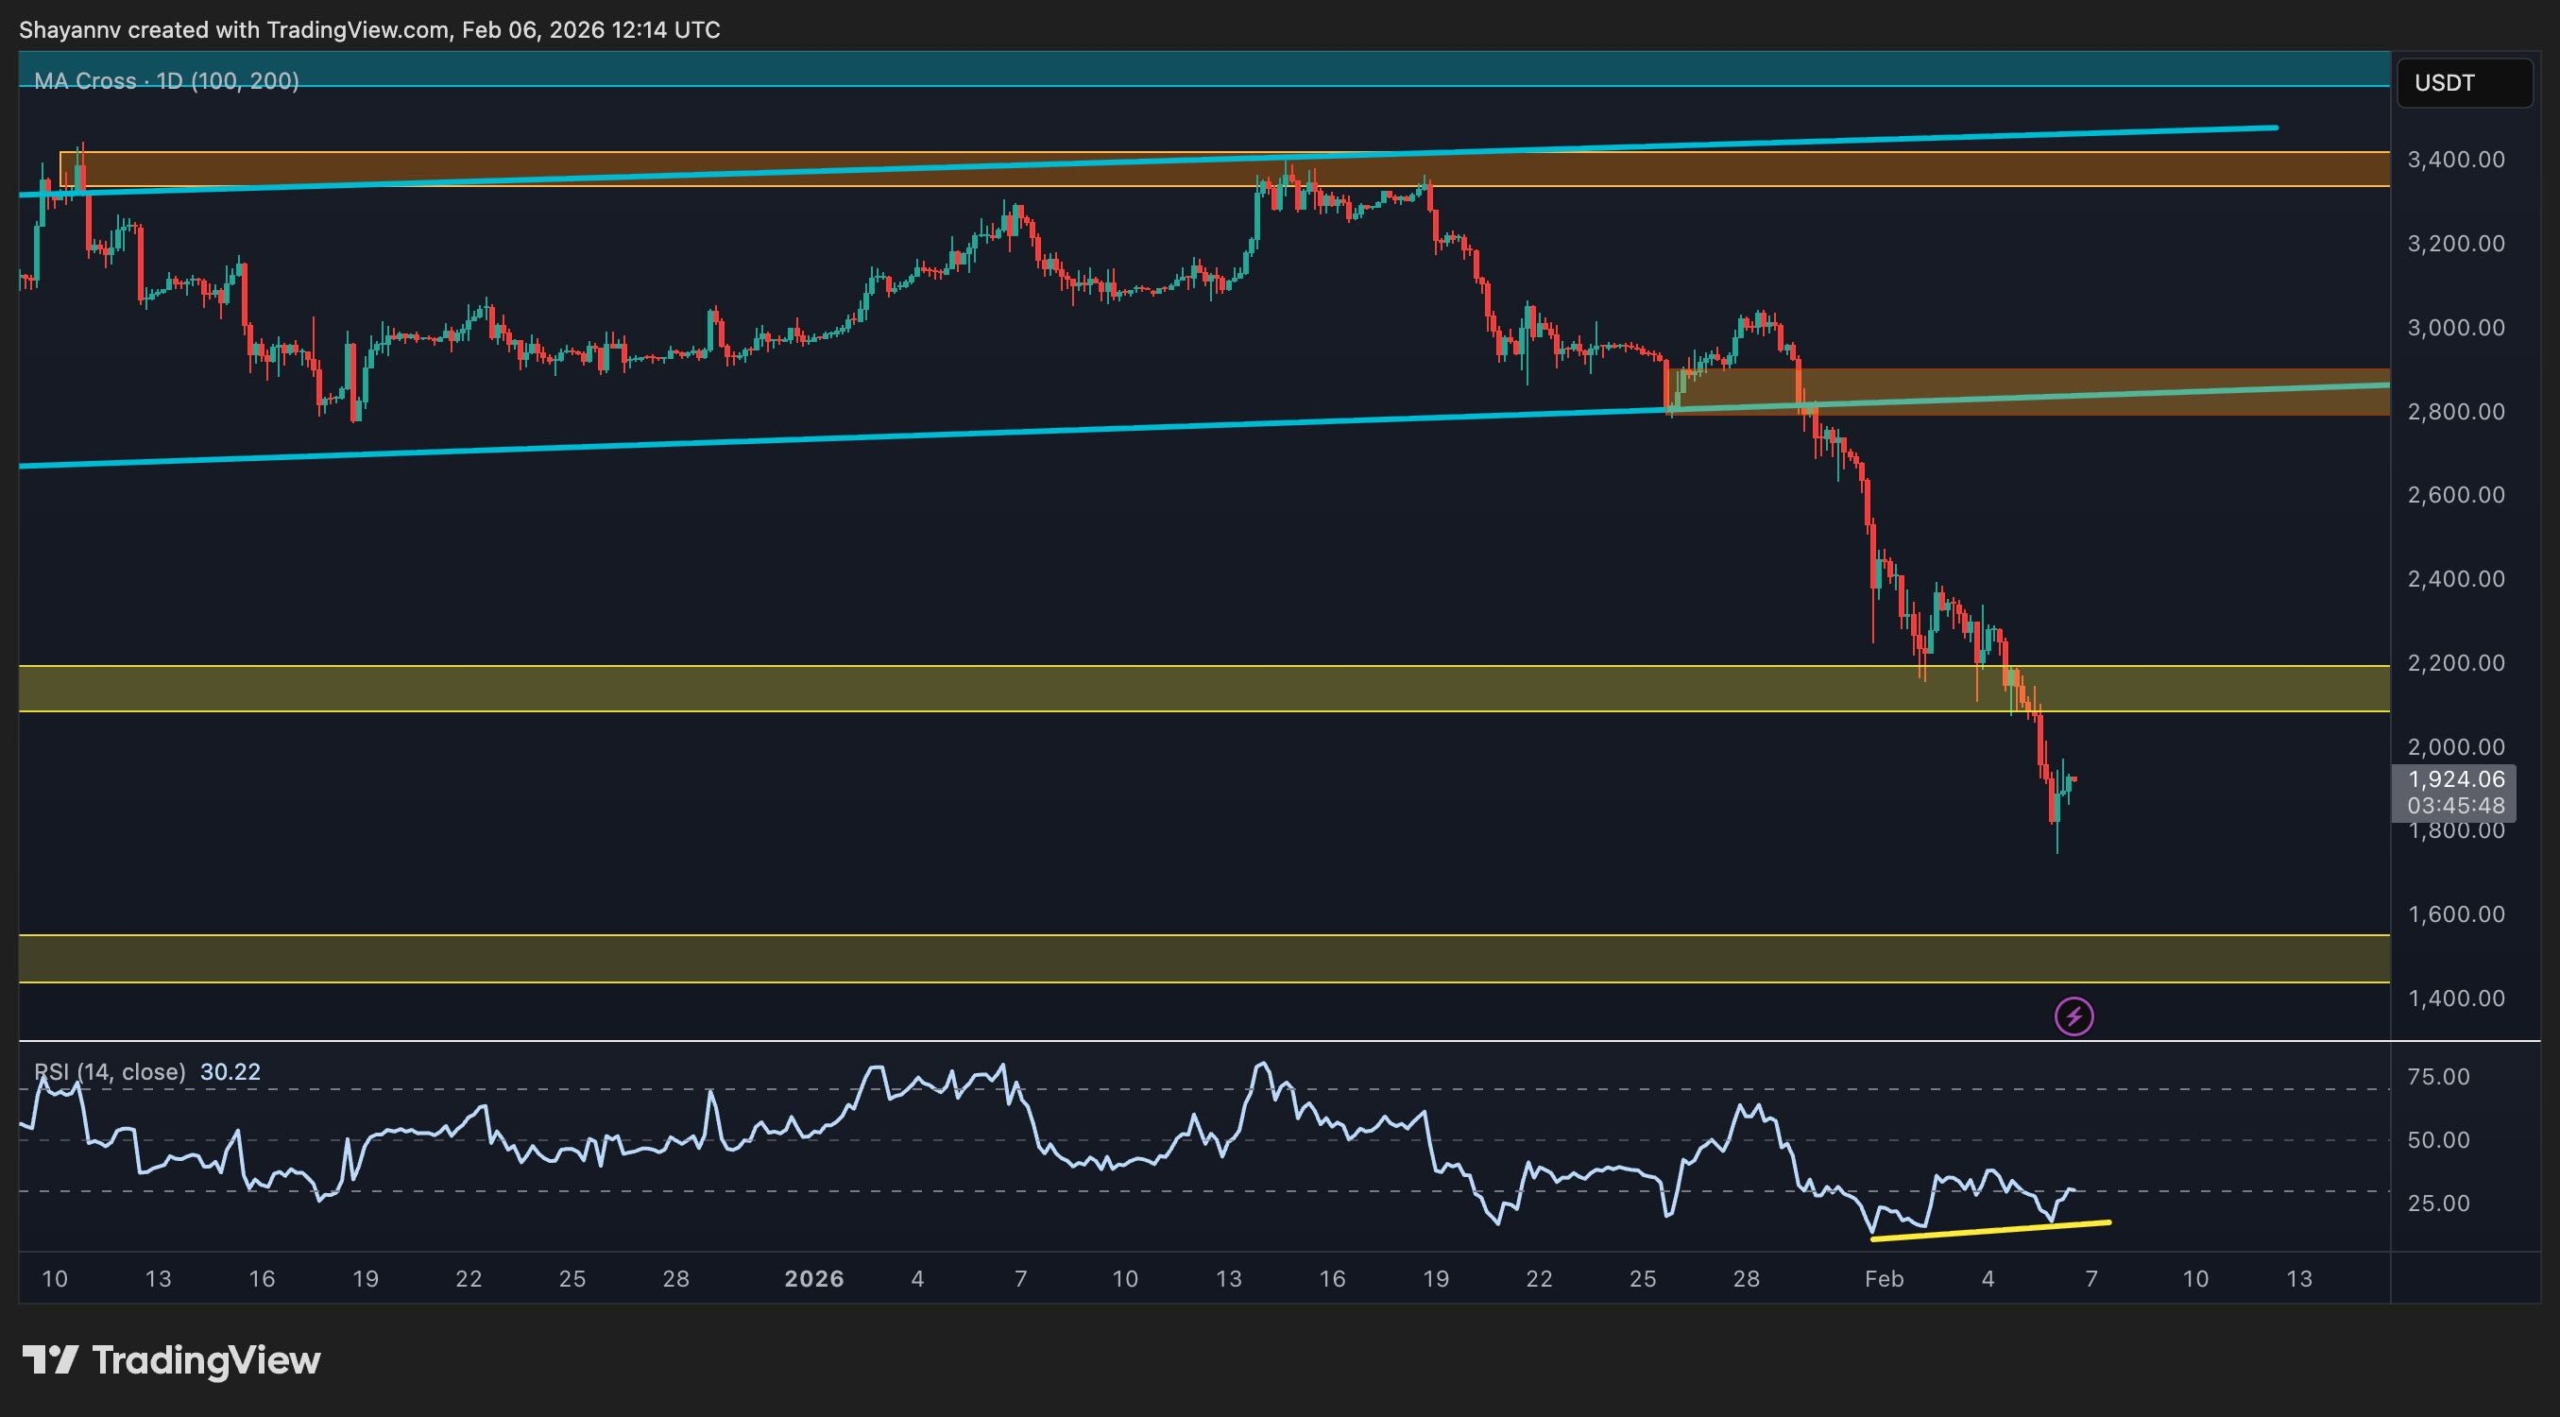
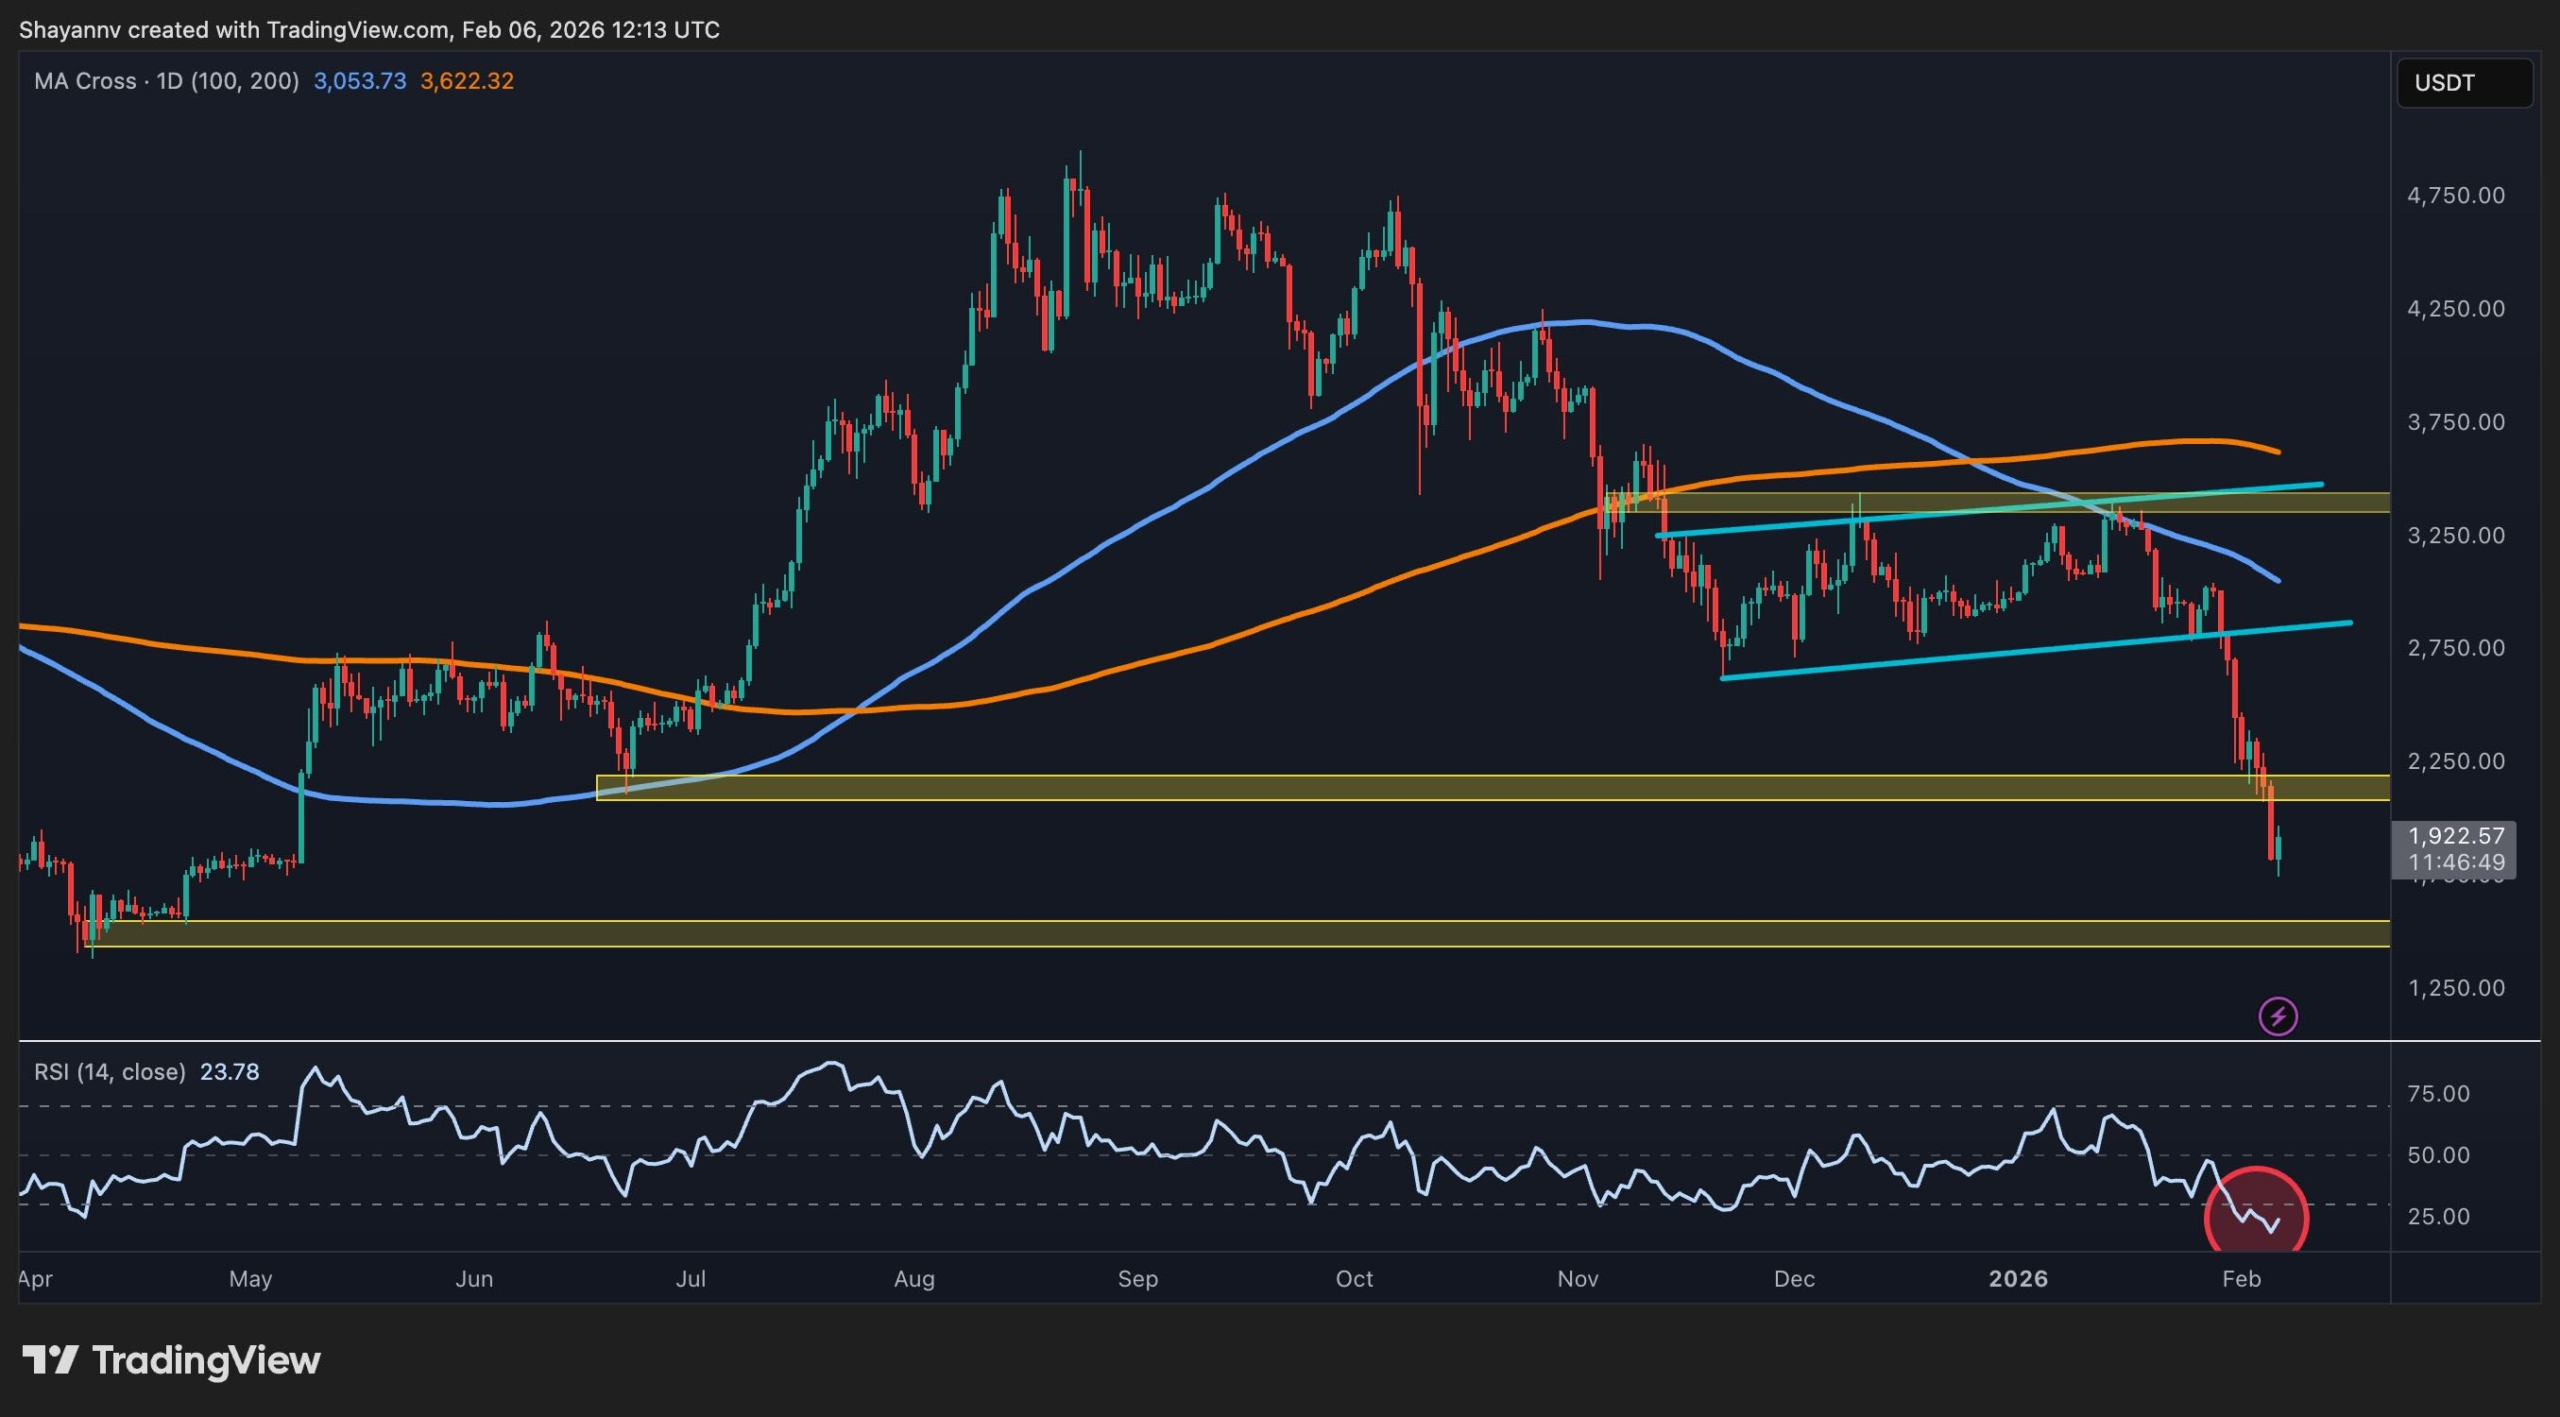
On the daily chart, ETH has broken down from the prior ascending structure that extended from the late-2025 lows and has failed to break above the 100-day and 200-day moving averages, which are now both located above the $3,000 mark. This price behavior has confirmed a transition from corrective sideways action into a clear downside trend.
The price has also broken below the first major demand band around the $2,200-$2,000 area, which coincides with a prior consolidation base and the origin of the last strong impulsive advance. Daily RSI has also fallen into deeply oversold territory in the low 20s, indicating stretched short-term conditions.
However, as long as the market remains capped below the broken moving averages and former support around $2,200, the broader structure continues to point toward a bear-market rally at best rather than a confirmed reversal.
ETH/USDT 4-Hour Chart
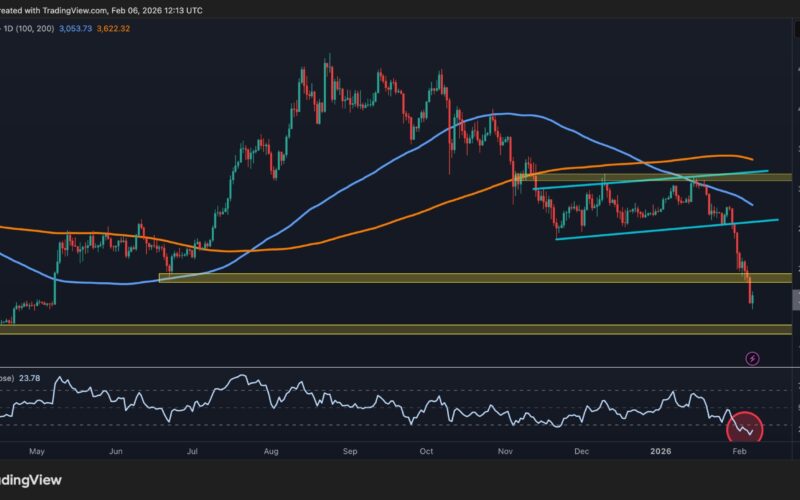
The 4-hour chart highlights the velocity of the current sell-off, with ETH cascading lower from the previously defended $2,800–$2,900 support and barely pausing on intermediate levels. The market is now trying to stabilize around the $1,850–$1,900 range, and a mild bullish divergence is emerging on the 4-hour RSI, where momentum has begun to print higher lows despite marginally lower price lows.
This configuration often signals that forced selling pressure is easing and that a short-term relief bounce or sideways consolidation may follow.
Immediate resistance now sits in the $2,100–$2,200 area, with a stronger supply zone at $2,800. Any rebound that stalls below these bands would keep the intraday trend firmly bearish, while a clean breakdown below the recent $1,800 low would pave the way toward the deeper demand zone at $1,500.
Sentiment Analysis
On the derivatives side, open interest across Ethereum futures has collapsed from elevated levels above 30 billion USD to nearly a third that size, tracking the price decline and signaling a large-scale liquidation cascade rather than an orderly reduction in positioning. This sharp contraction in open interest indicates that a significant portion of leveraged longs has been forced out of the market, with margin calls and auto-deleveraging accelerating the downside once key support levels failed.
While such events are painful in the short term, they also tend to cleanse excess leverage from the system, leaving a lighter positioning backdrop where spot flows and fresh capital, rather than crowded derivatives exposure, can play a larger role in setting the next directional move.

The post Ethereum Price Prediction: Is $1,500 Next for ETH After the ‘Aggressive Deleveraging’? appeared first on CryptoPotato.
Source link


