


Ethereum is showing renewed strength as it breaks out from key technical patterns, aligning with broader crypto market optimism. This move comes amid continued ETF speculation, increased institutional activity, and a wave of geopolitical instability driving capital into decentralized assets. Despite macro uncertainty, ETH’s structure across multiple timeframes and on-chain data reflect improving sentiment and positioning.
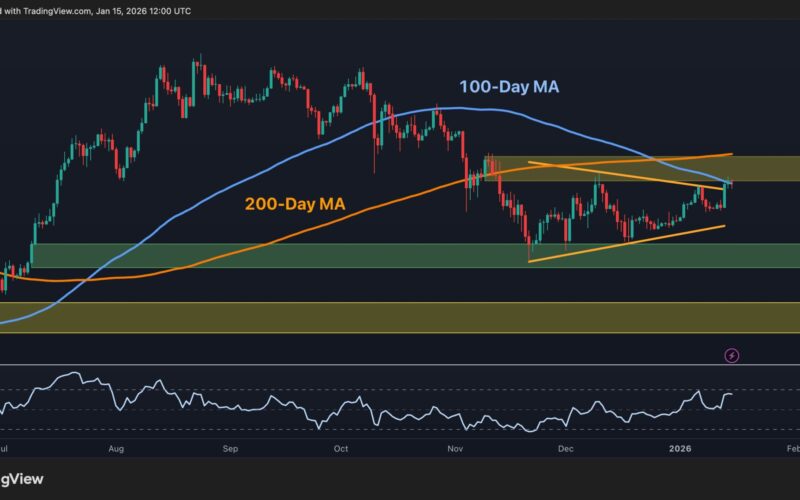
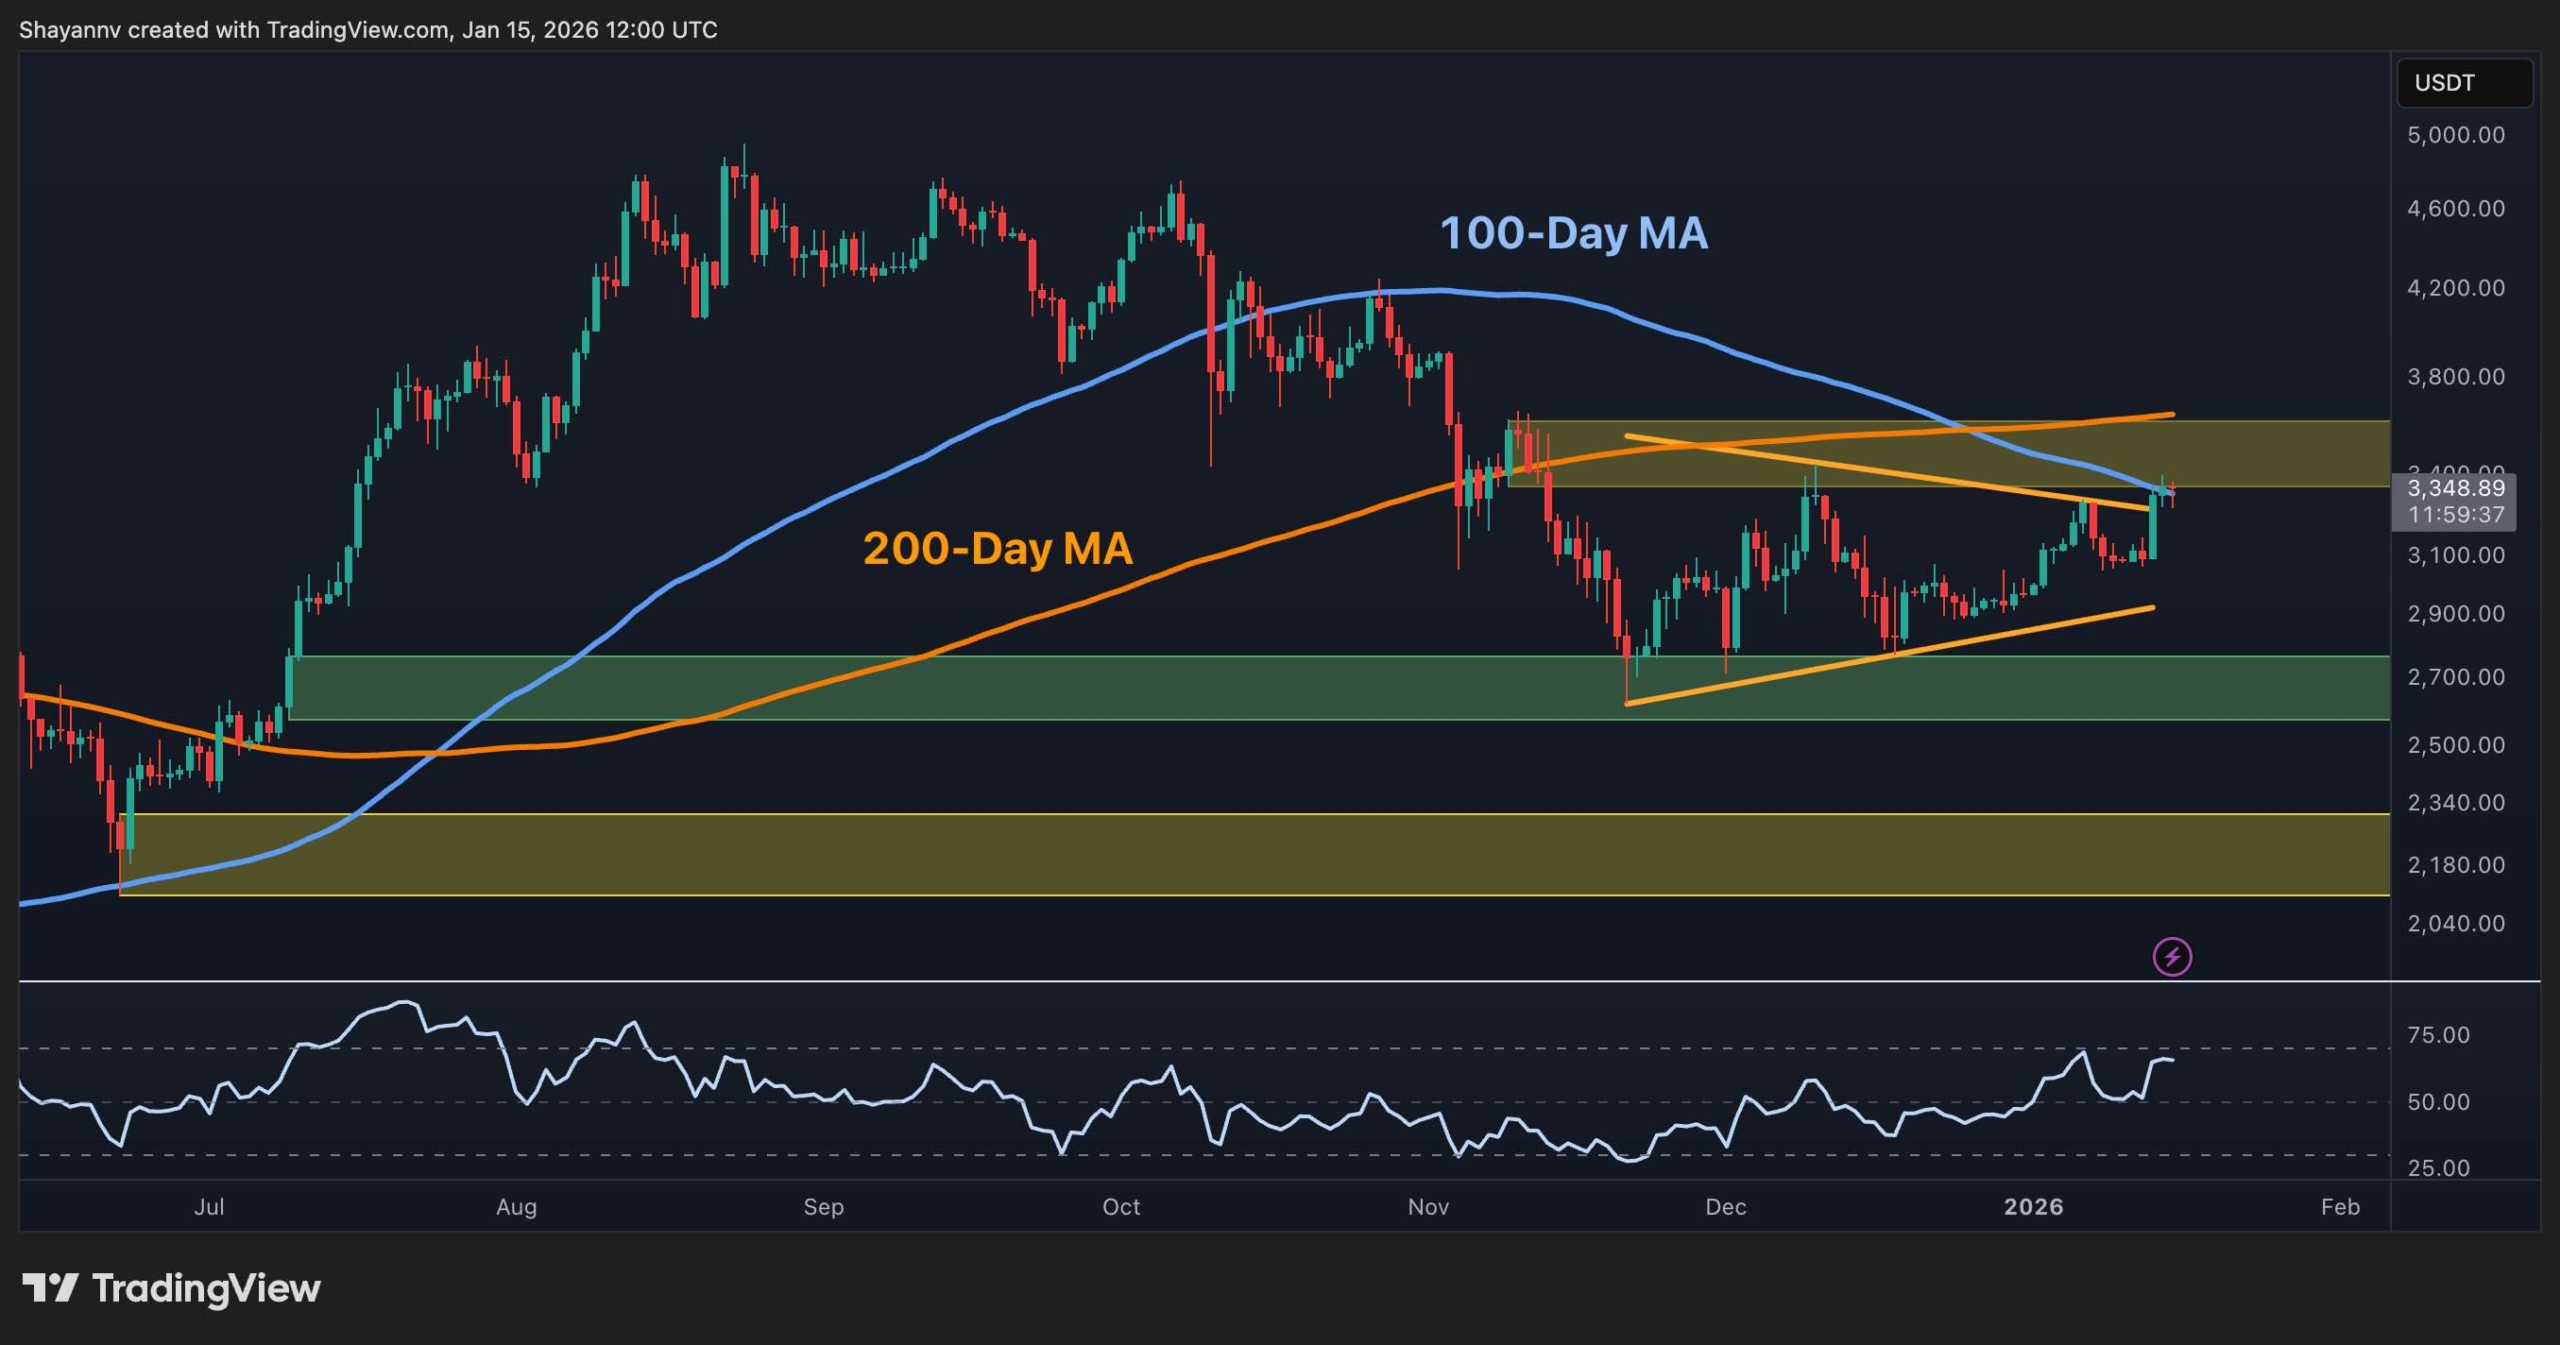
Ethereum Price Analysis: The Daily Chart
On the daily chart, ETH has successfully broken out from the symmetrical triangle formed over the past two months. This breakout was supported by the RSI regaining bullish momentum above the 60 level. The asset is also trying to reclaim the 100-day MA and the $3,400-$3,600 area, a key resistance level that aligns with a previous order block and supply zone.
If buyers break above this level, the next key resistance will be the 200-day moving average, which lies around the $3,800. On the downside, the $3,000 and $2,700 levels are critical support levels that should be protected by the buyers for the market not to turn bearish.
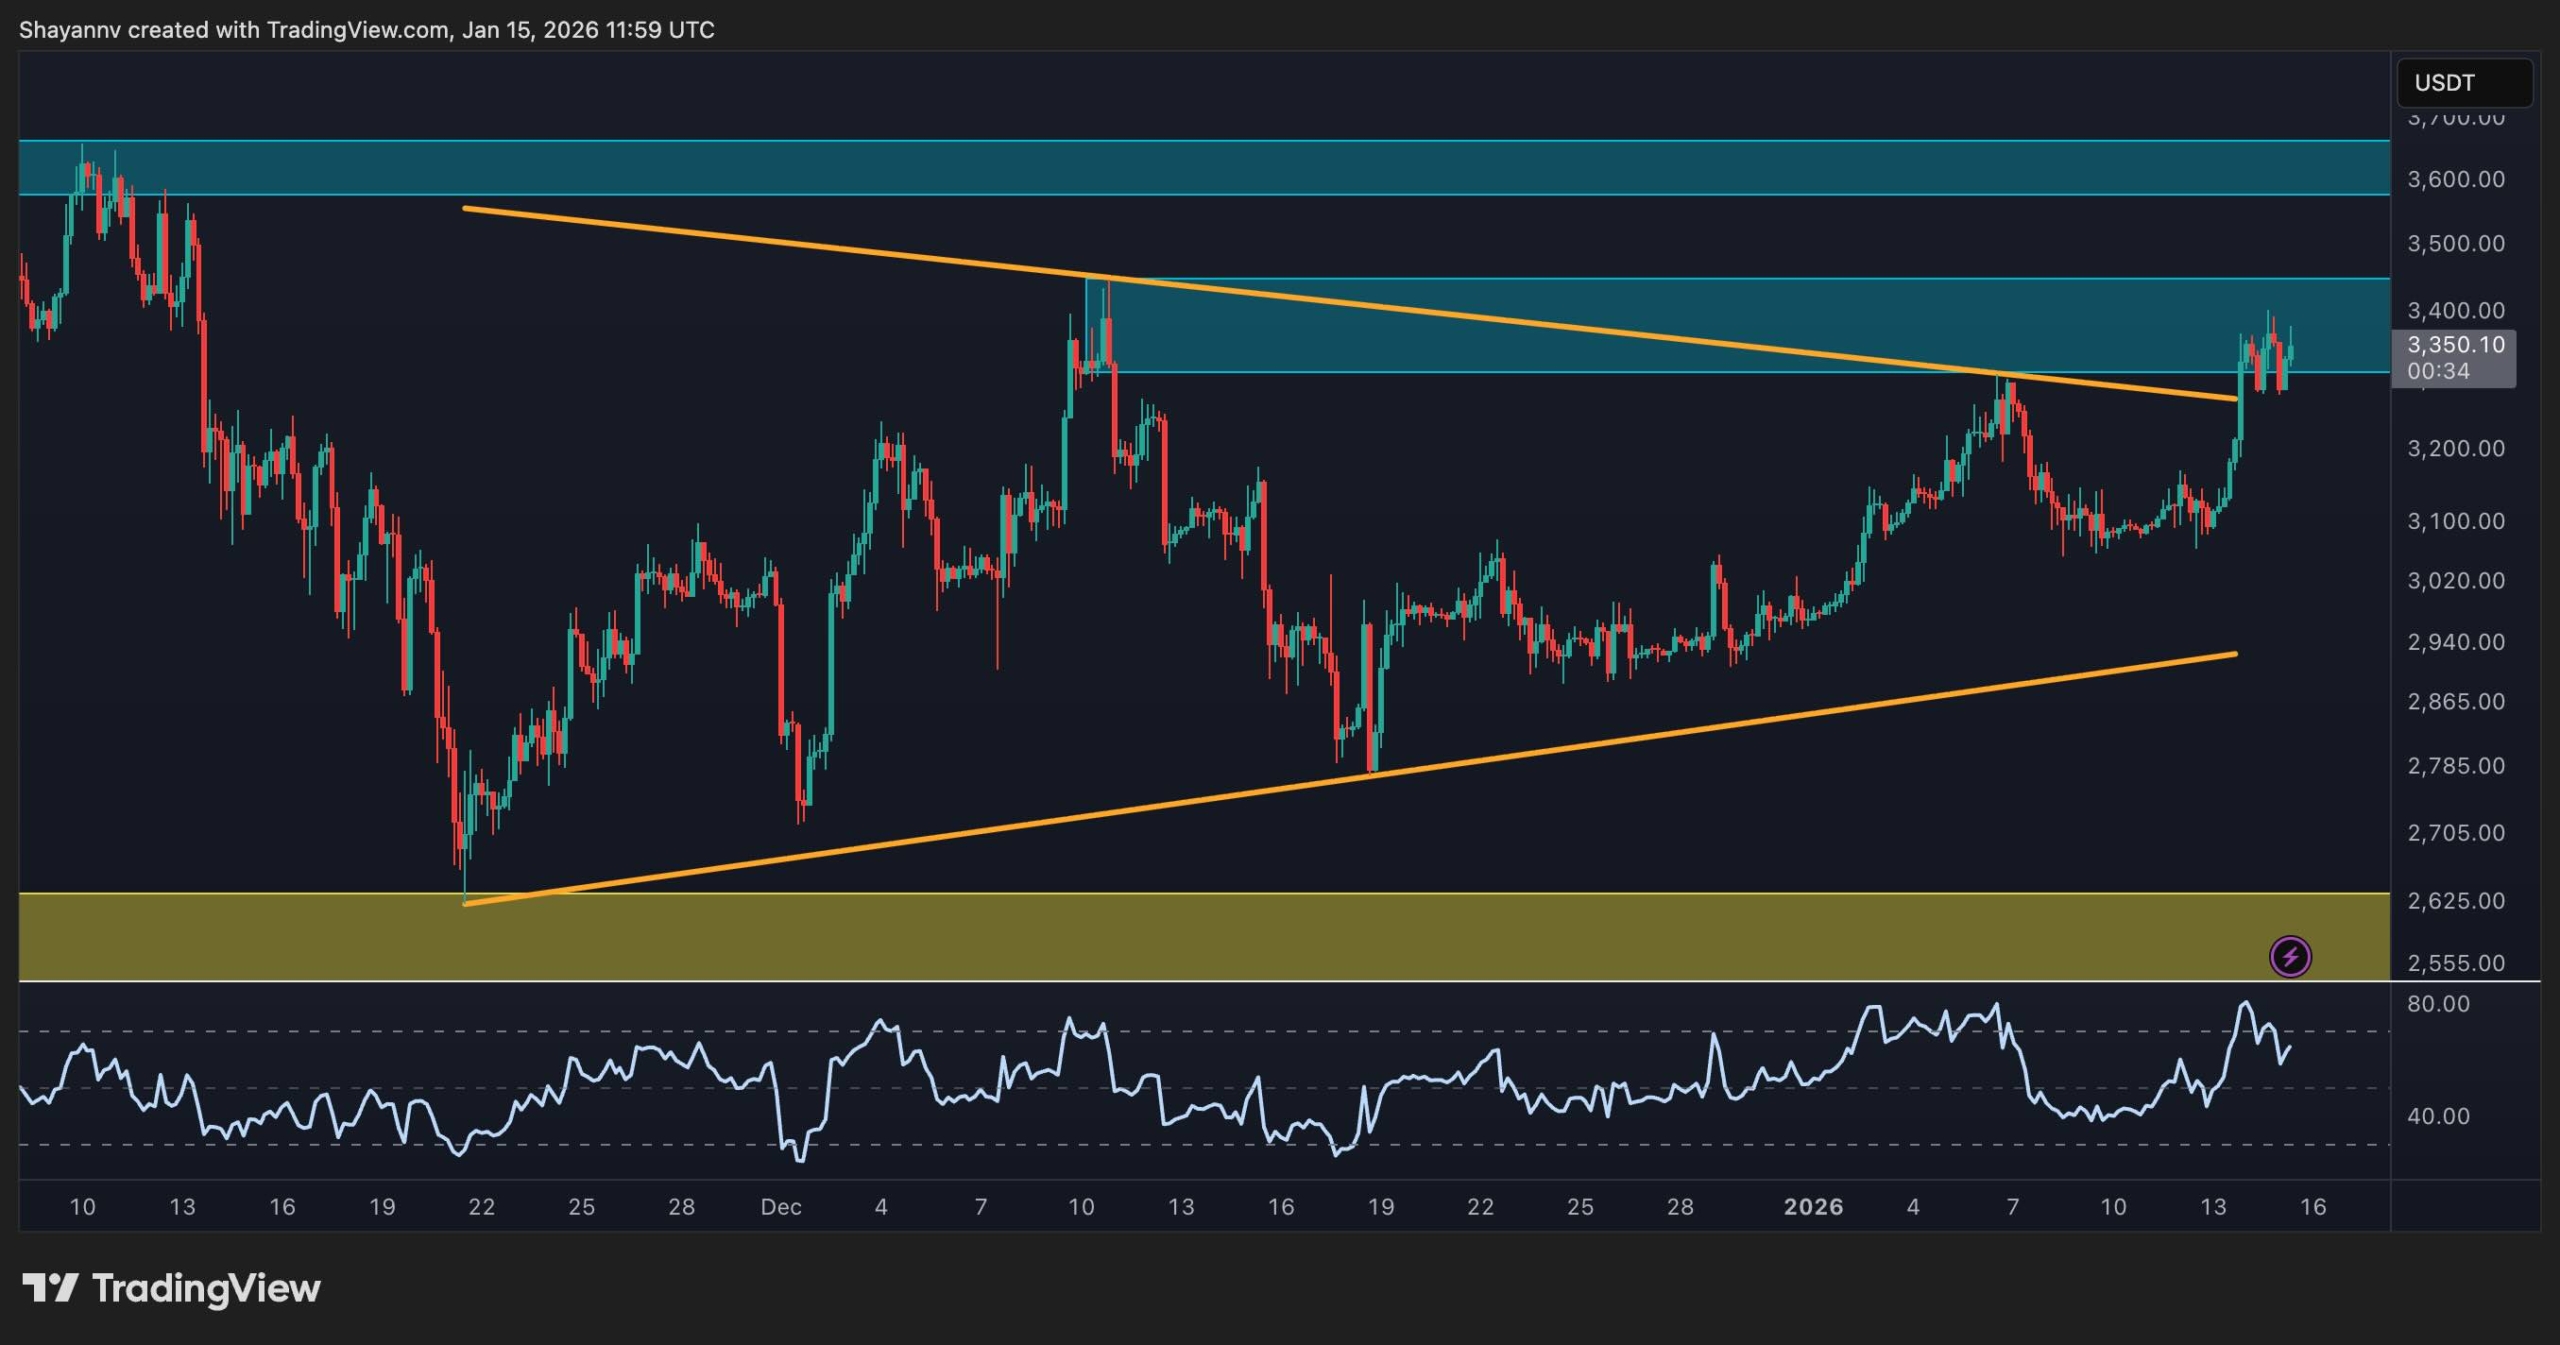
ETH/USDT 4-Hour Chart
On the 4-hour chart, ETH has clearly broken out of its symmetrical triangle, with a strong bullish push through the $3,300–$3,500 resistance zone. This zone had acted as a ceiling for weeks. The price is now consolidating around it, and this might suggest a cooldown before the next leg higher.
The RSI, however, is pulling back from the overbought region, which indicates that a consolidation or pullback is likely before a continued rally. As long as the price holds above the broken pattern, a continuation towards the $3,600–$3,700 range remains likely. On the other hand, a break below $3,200 would invalidate the immediate bullish structure and could trigger a drop back toward the $3,000 level and even lower.
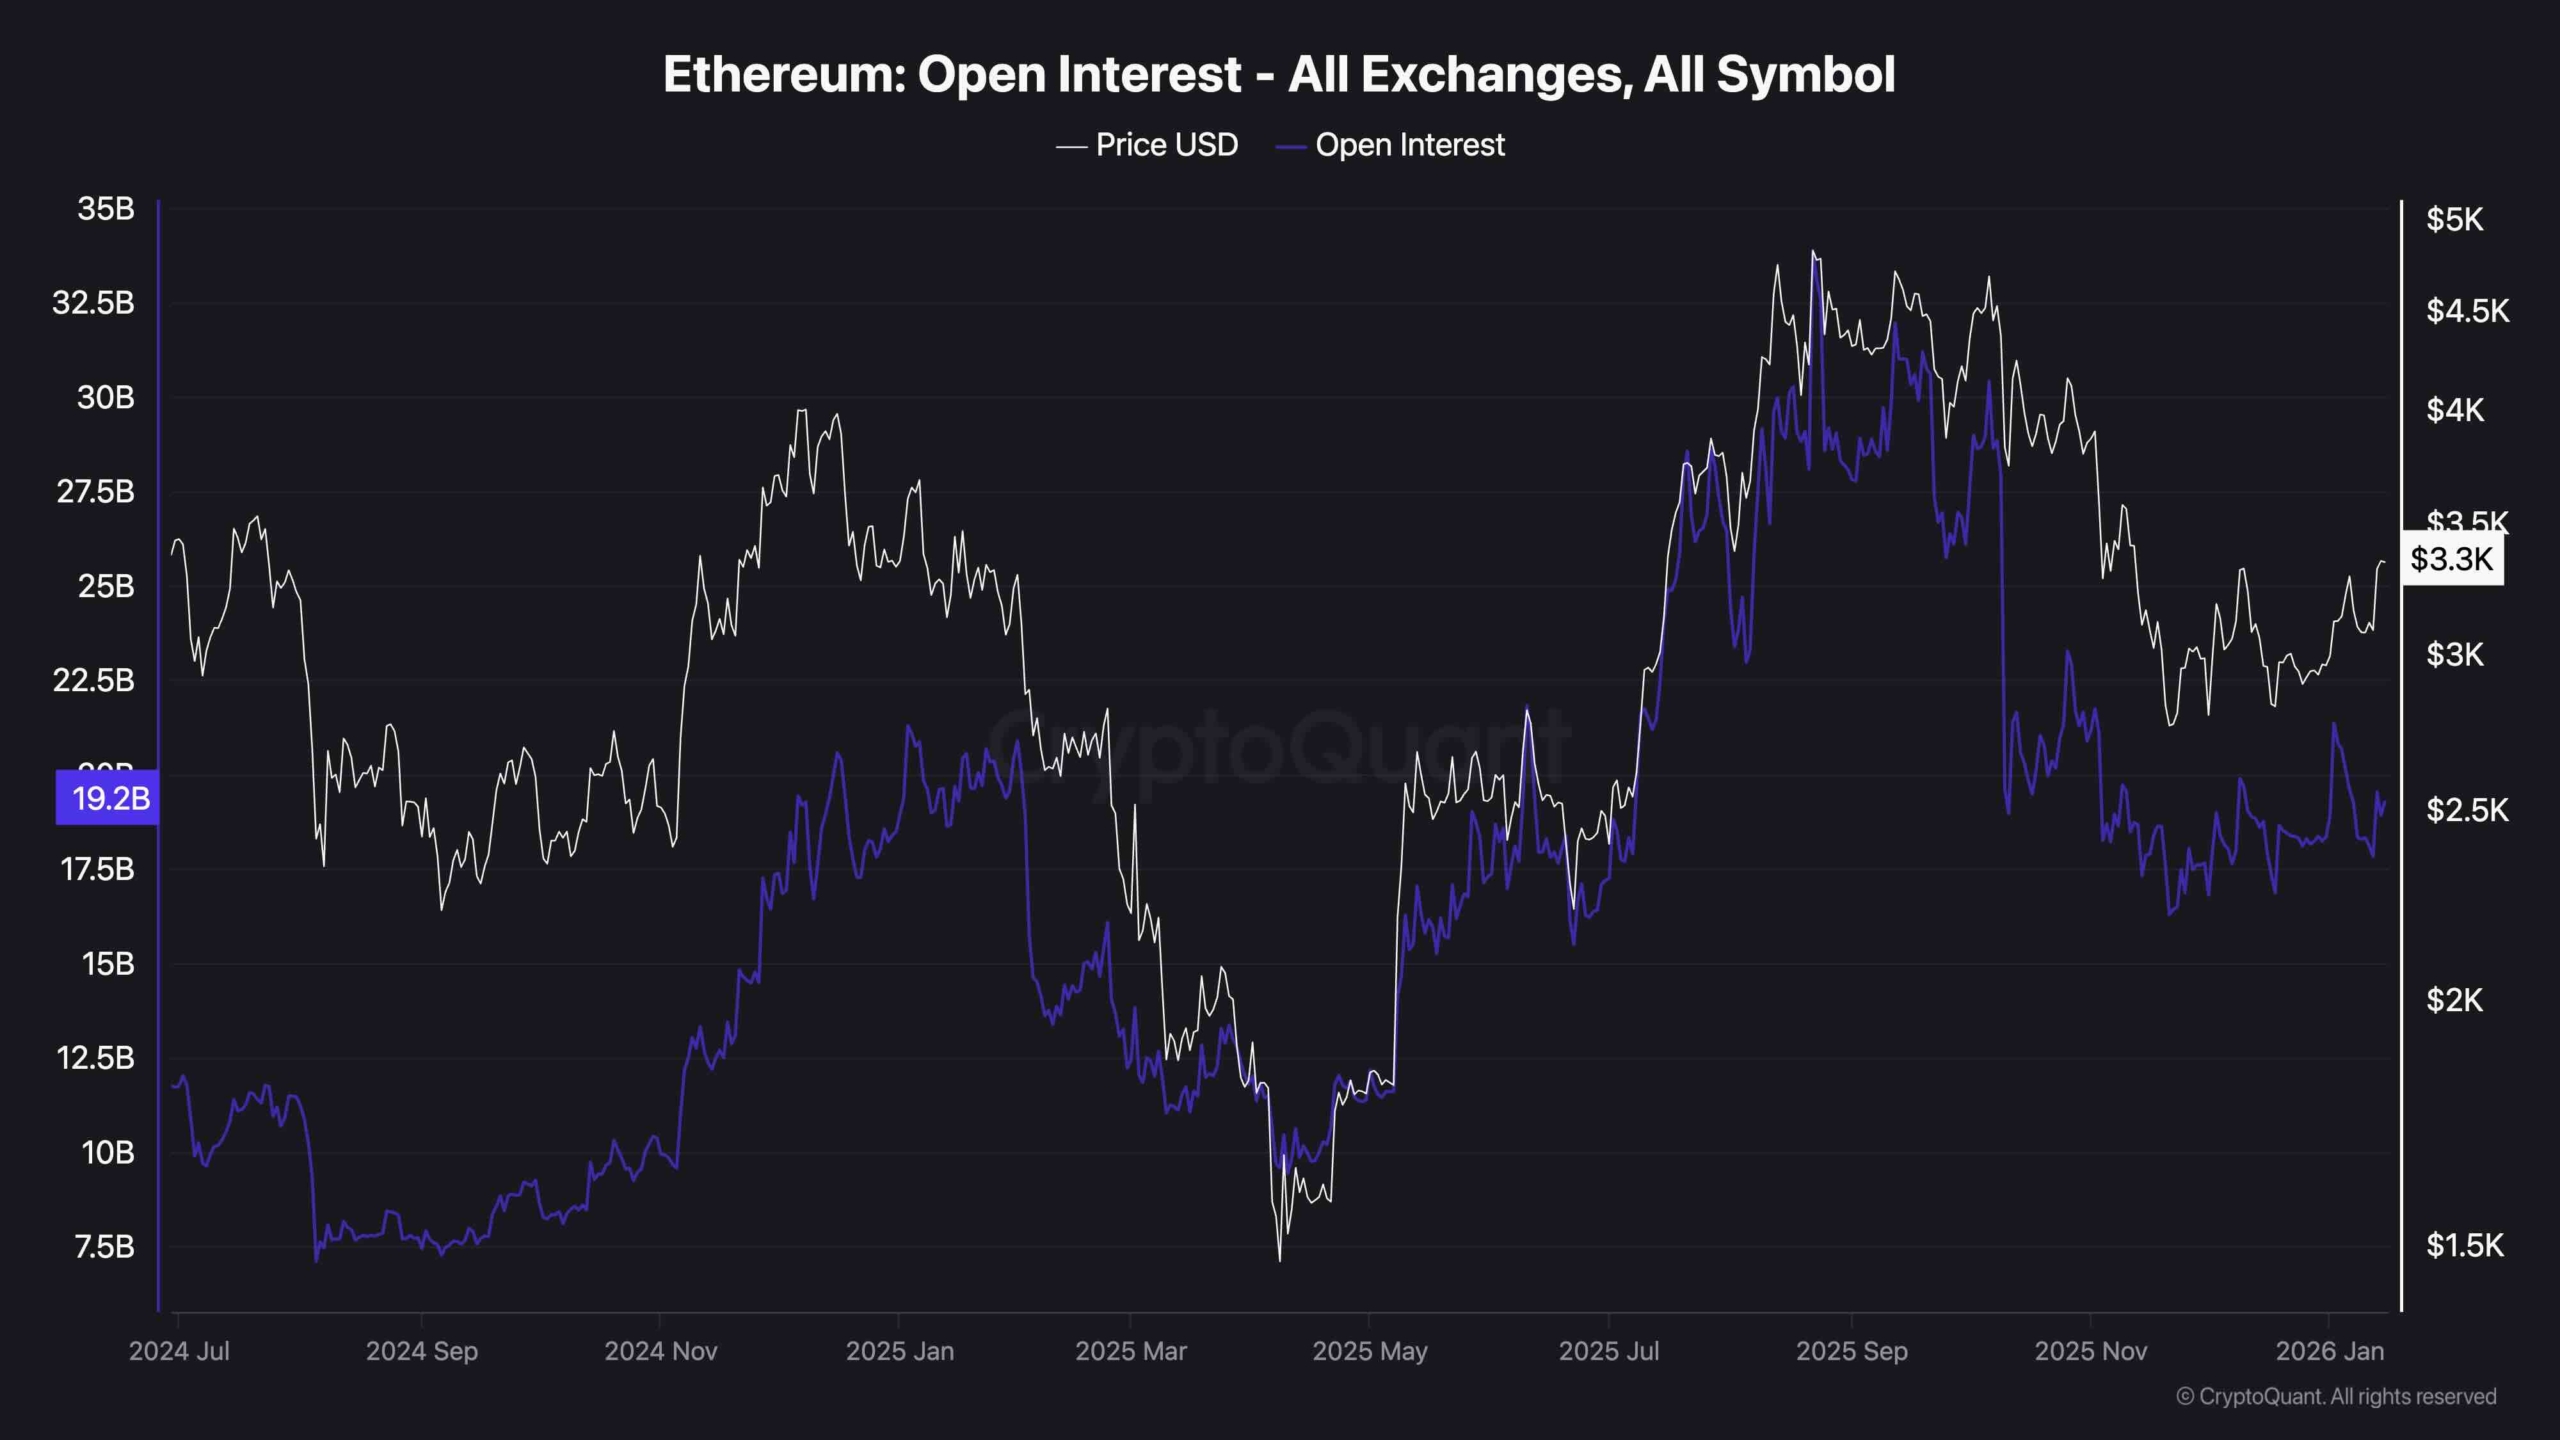
Sentiment Analysis
From a futures market sentiment perspective, Ethereum’s open interest has been oscillating horizontally, now around $19.2B across all exchanges.
This suggests that both leveraged short and long positions have been getting liquidated during the recent consolidation, making a liquidation cascade less likely in the short term. As a result, if sufficient spot demand is present, the price could recover sustainably and likely move toward the $4K mark in the coming weeks.
The post Ethereum Price Analysis: Is $4K Realistically Within Reach for ETH? appeared first on CryptoPotato.
Source link


