


Ethereum remains in a corrective structure, but the recent price behaviour suggests the market is attempting to stabilize after a prolonged downside phase. Current price action is compressing near key technical levels, making the next directional move increasingly important.
Ethereum Price Analysis: The Daily Chart
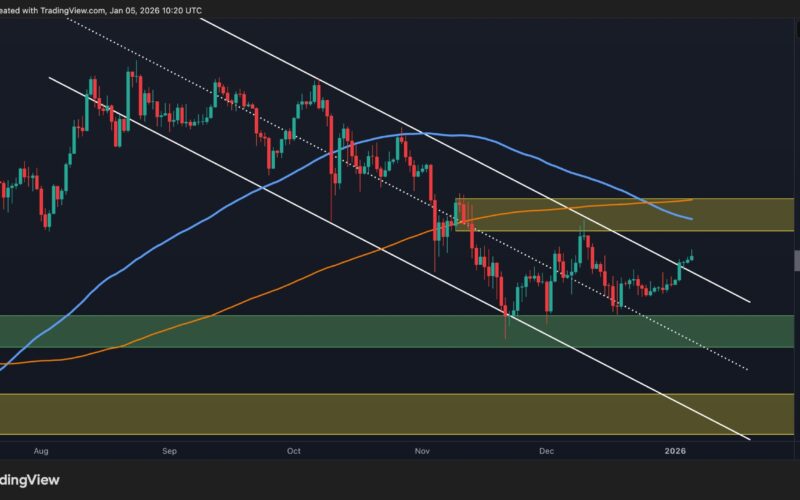
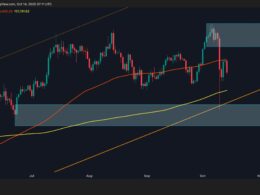
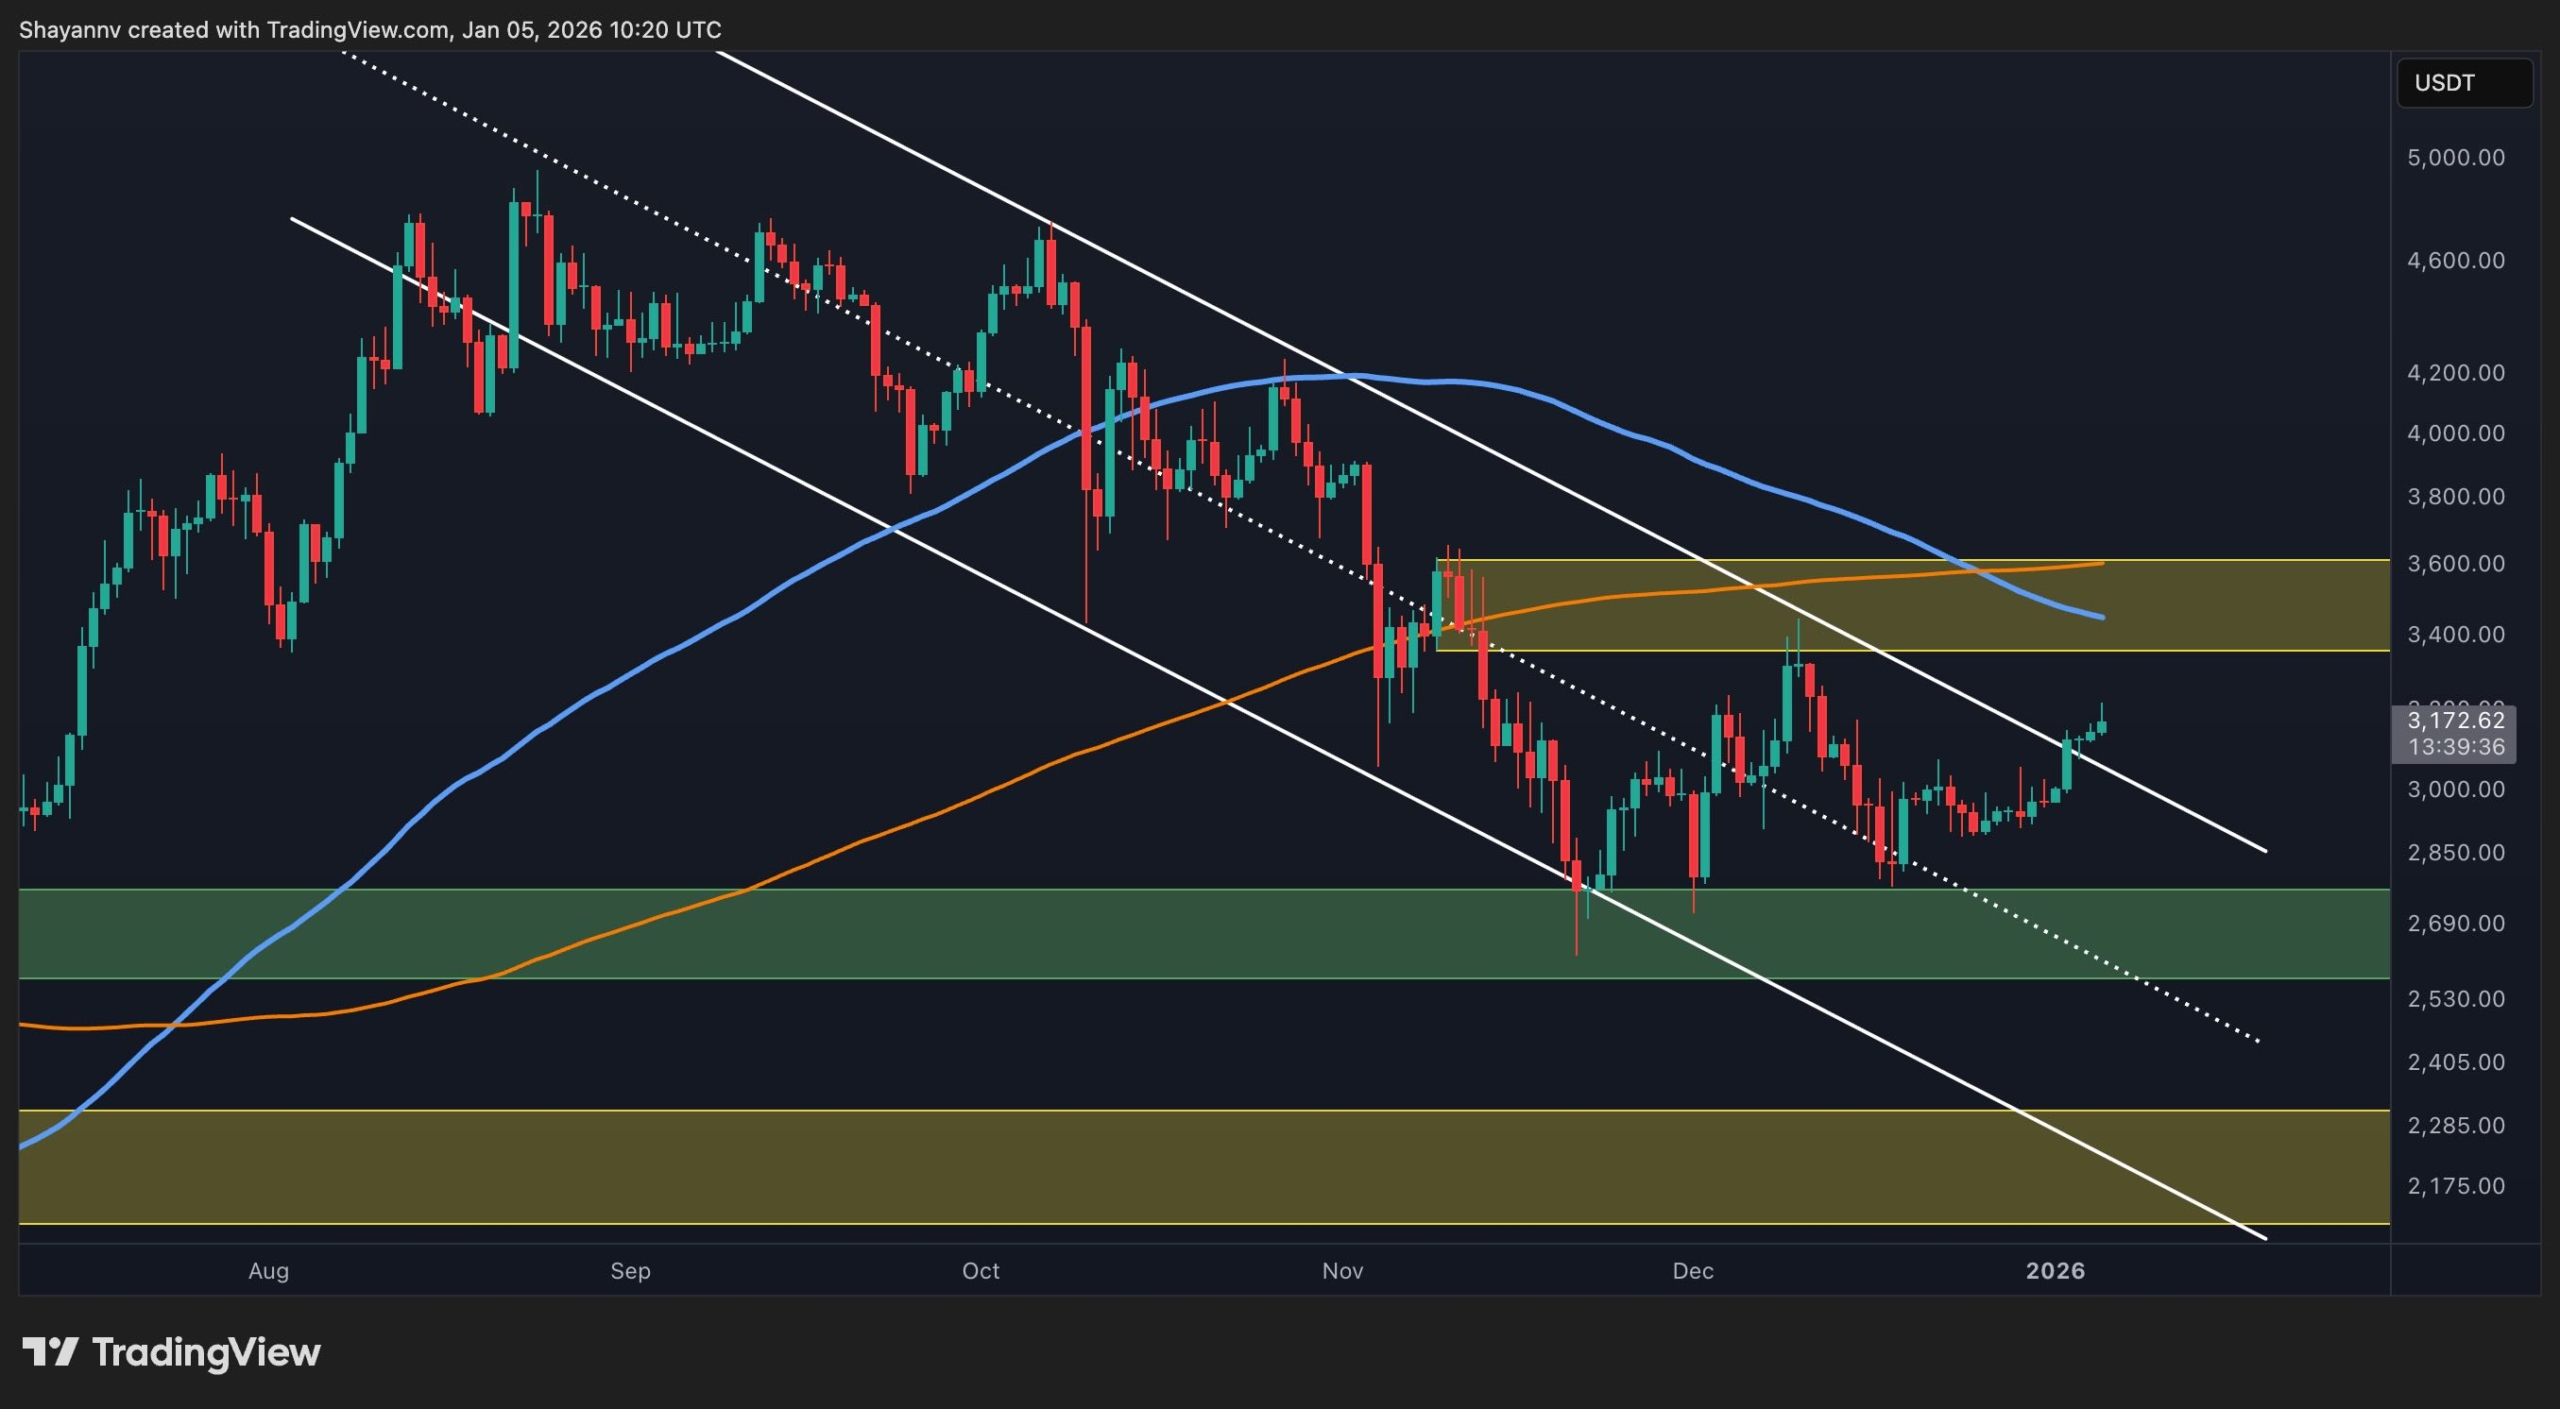
On the daily chart, ETH has slightly broken above the broader descending channel that has defined the price action for several months. The recent advance has pushed the asset back toward the upper boundary of this structure, resulting in a local bullish breakout attempt above the short-term channel dynamics. However, this breakout lacks strong momentum or follow-through, raising the risk that it is corrective rather than impulsive.
ETH is now reacting beneath a major supply zone around the $3.5K range, which overlaps with the moving average resistance. This area continues to cap upside attempts and has repeatedly triggered sell pressure. As long as Ethereum remains below this zone, the broader daily structure stays neutral to bearish, with upside moves better classified as retracements rather than trend reversals. Sustained acceptance above this resistance would be required to confirm a structural shift toward a new bullish cycle.
ETH/USDT 4-Hour Chart
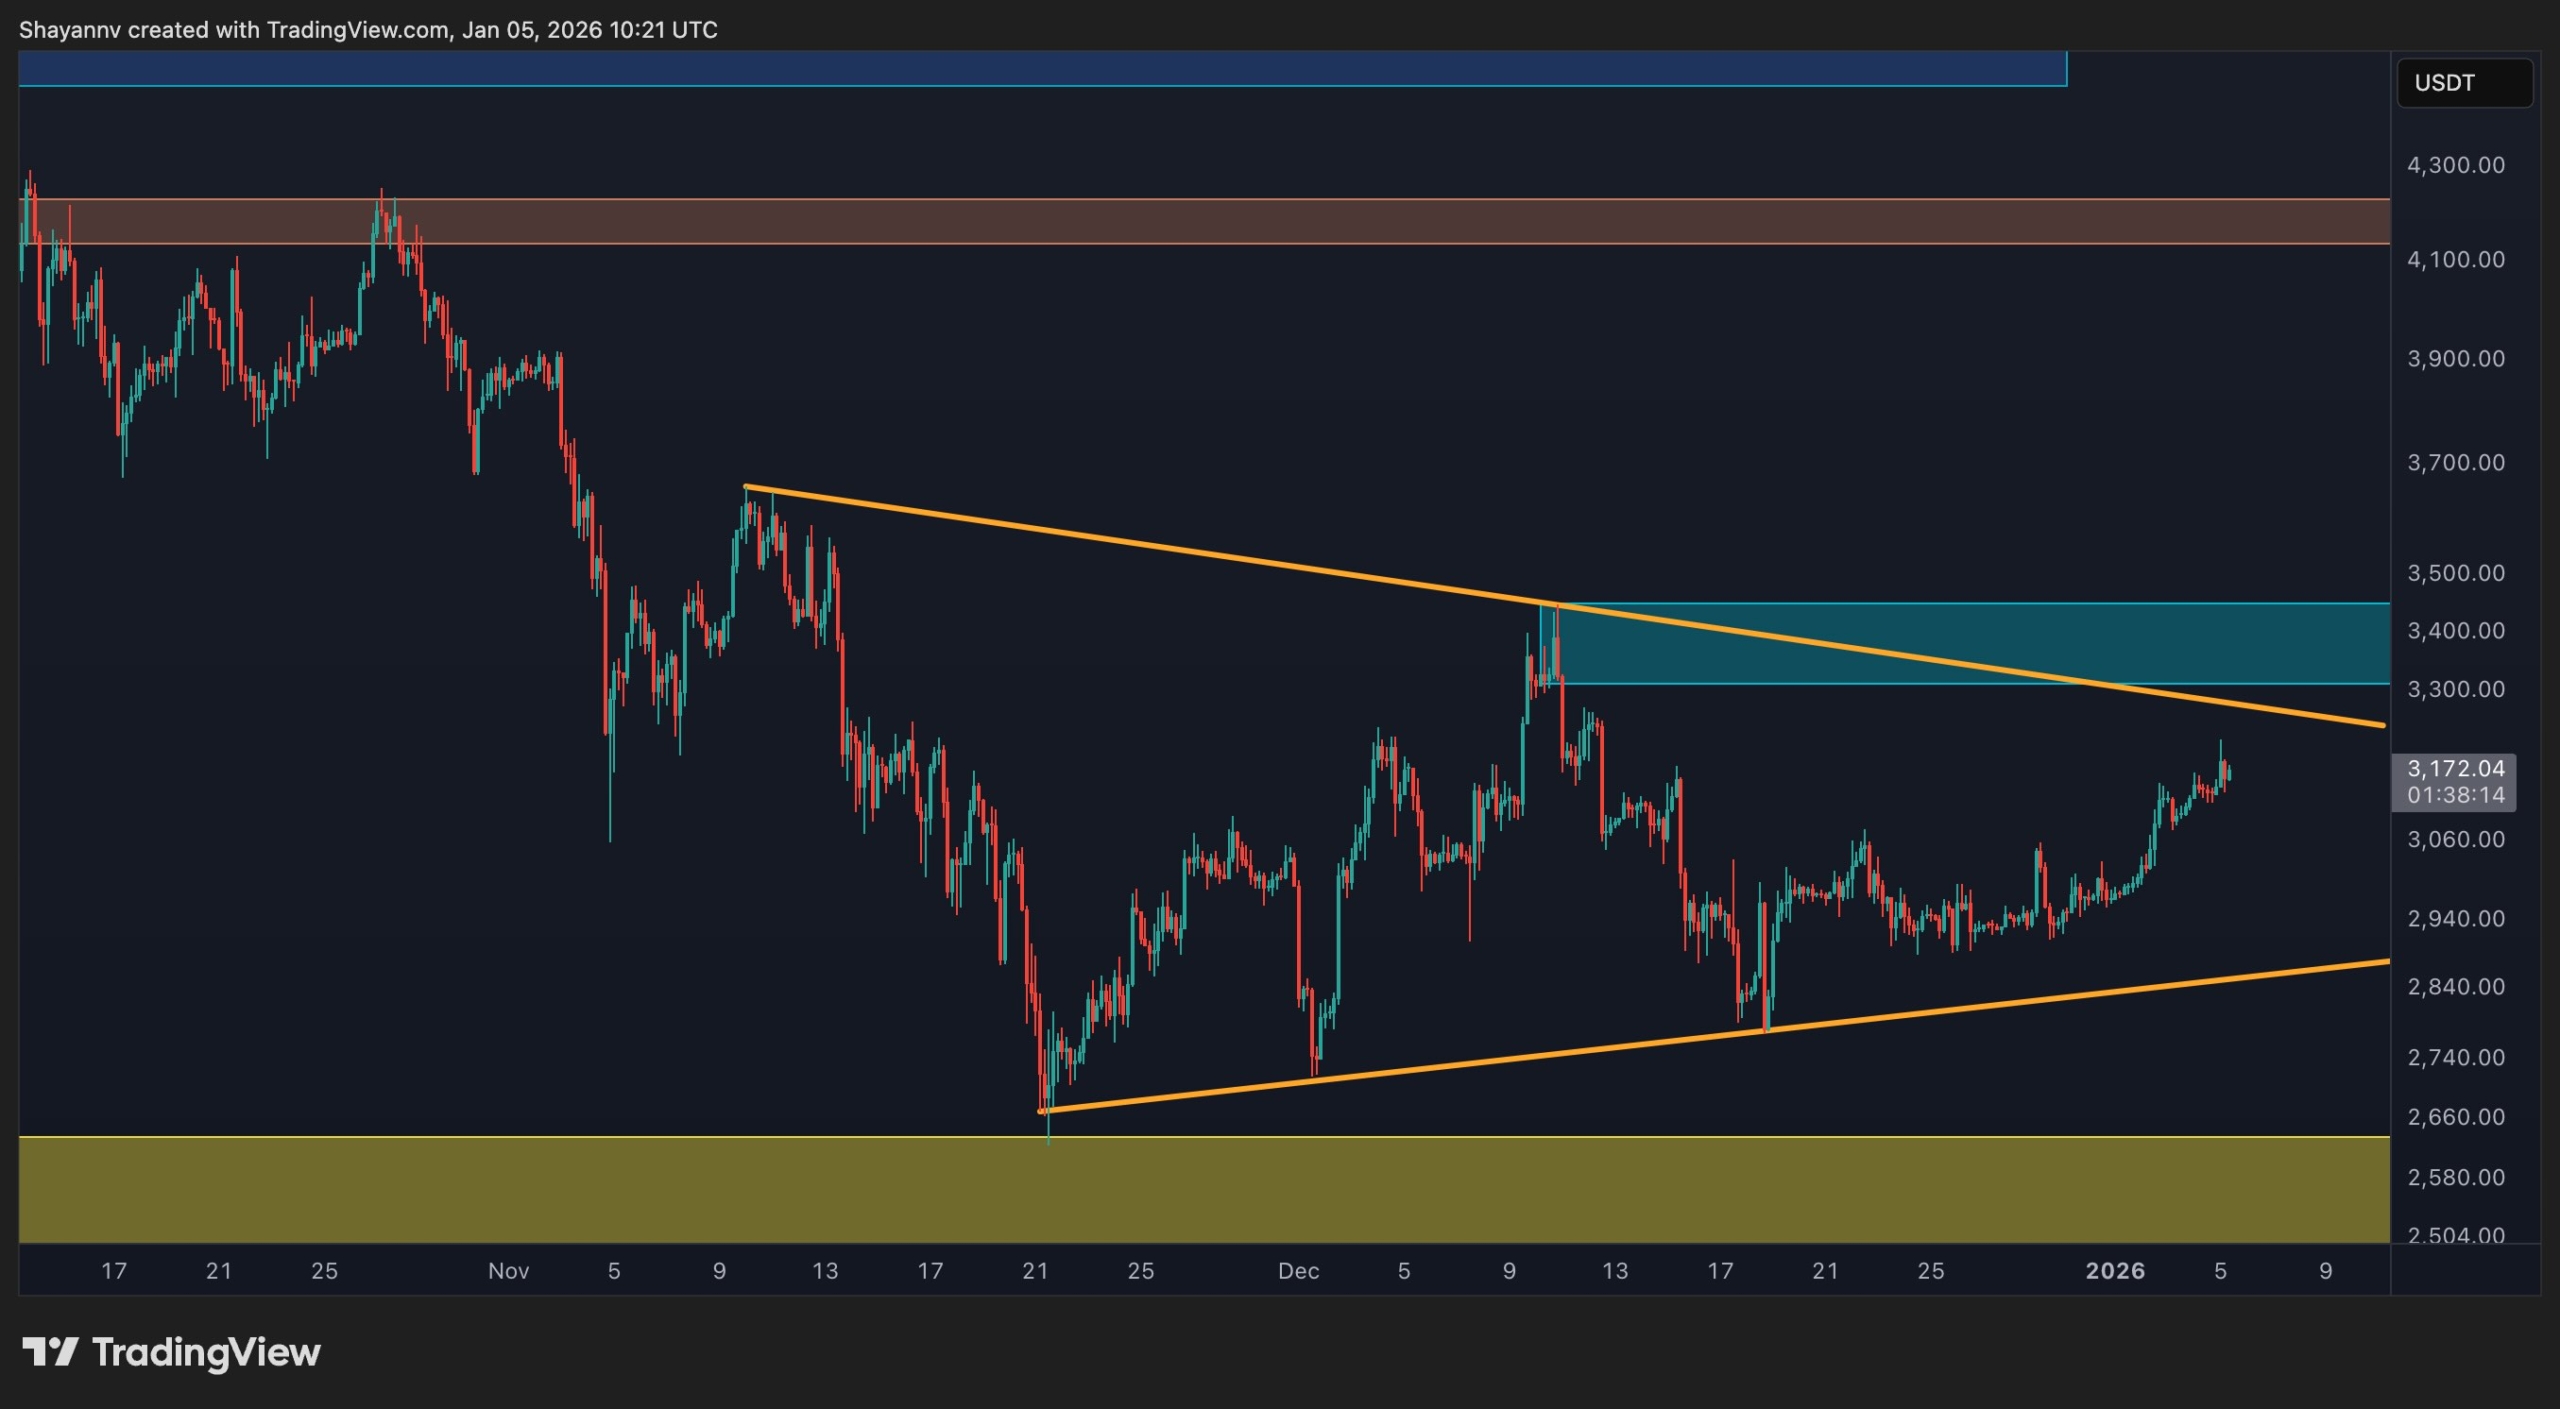
On the four-hour chart, Ethereum is consolidating within a narrowing wedge formation. This structure reflects decreasing volatility and a balance between buyers and sellers after the prior impulsive sell-off. The asset is respecting both the rising lower trendline and the descending upper boundary, suggesting that the market is waiting for a catalyst before committing to direction.
This consolidation alone is not sufficient to signal a bullish continuation. A decisive breakout above the wedge at $3.4K, ideally with strong displacement and acceptance, would be needed to confirm renewed bullish momentum. Until that occurs, the current price action should be treated as range-bound and corrective, with the risk of another rejection remaining elevated if resistance continues to hold.
Onchain Analysis
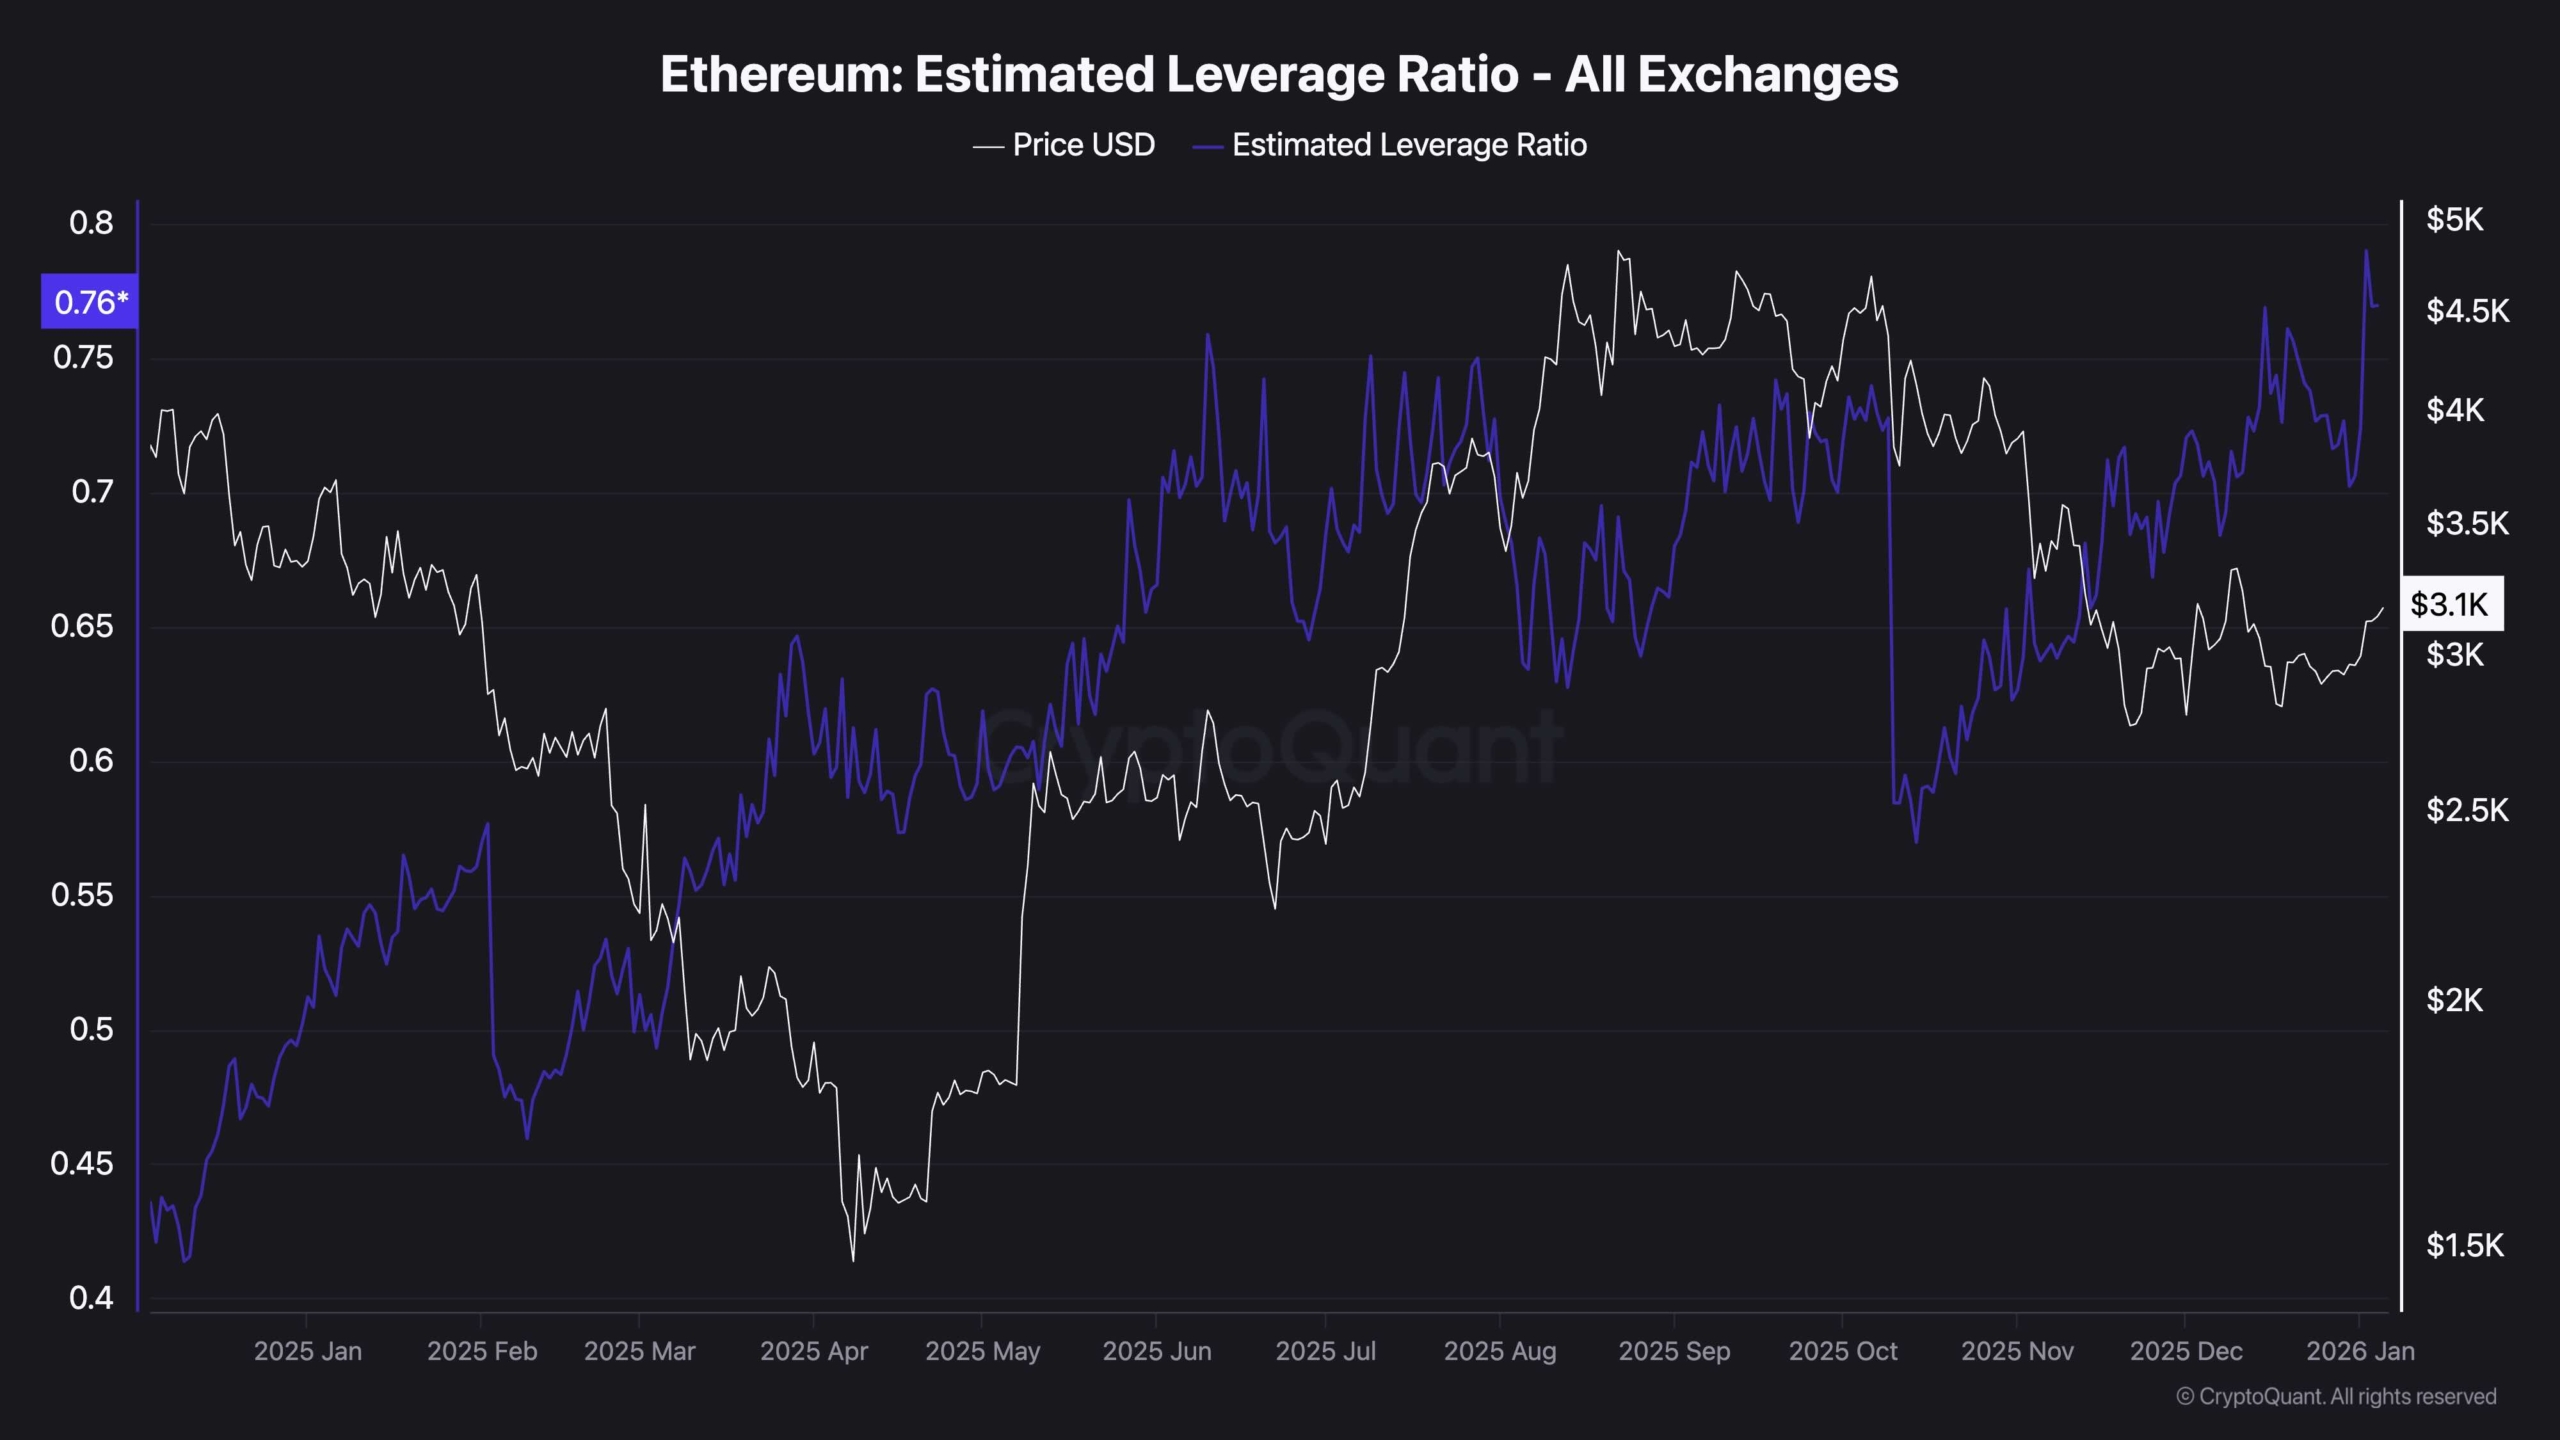
Ethereum’s leverage ratio on Binance has reached an unprecedented high of 0.8, surpassing the previous peak in December. This surge reflects growing trader confidence and increased market fragility.
This indicator measures the extent to which market participants use borrowed capital relative to their collateral. Extreme levels indicate heavily leveraged open positions, which can trigger forced liquidations and amplify volatility.
Ethereum is trading near $3.1K, suggesting upward momentum from liquidity in the futures market. While rising prices and expanding leverage often indicate strong risk appetite, this dynamic is unstable. Elevated leverage can quickly become a source of downside pressure if sentiment shifts or price action stalls.
Historically, record-high leverage ratios have been followed by sharp volatility spikes, either through pullbacks or aggressive price swings to eliminate excess leverage. While the current Estimated Leverage Ratio level isn’t a standalone bearish signal, it serves as a cautionary flag, especially for short-term traders in a crowded and leverage-heavy environment.
SECRET PARTNERSHIP BONUS for CryptoPotato readers: Use this link to register and unlock $1,500 in exclusive BingX Exchange rewards (limited time offer).
Disclaimer: Information found on CryptoPotato is those of writers quoted. It does not represent the opinions of CryptoPotato on whether to buy, sell, or hold any investments. You are advised to conduct your own research before making any investment decisions. Use provided information at your own risk. See Disclaimer for more information.
Source link

