


Bitcoin is trading around $111,500 after falling 4% in the past 24 hours and 10% over the last week, based on CoinGecko data.
Price action remains stuck in a wide range, with no clear trend emerging. Volatility is high, but the market lacks strong momentum in either direction.
BTC Faces Resistance, Holds Support
Bitcoin was recently rejected from the $115,500–$116,000 zone, which had previously served as support but now acts as resistance. On the upside, $119,500 remains a key level that bulls need to break to test new highs. On the downside, buyers are watching $107,300 as support. A deeper zone of interest lies between $103,900 and $100,800.
Nothing special on todays correction of #Bitcoin.
Just some standard chop happening here, as likely, the volatility will remain high before there’s a clear new trend. pic.twitter.com/sH5rFw32St
— Michaël van de Poppe (@CryptoMichNL) October 14, 2025
Michaël van de Poppe commented on the current setup, saying there is “nothing special” about the recent price movement. He added that “volatility will remain high before there’s a clear new trend.” This suggests that the price may continue to swing within the current range for some time.
Volume remains steady, showing that traders are active. However, the market has not picked a clear direction.
$100K in Sight? Analyst Charts Path Lower
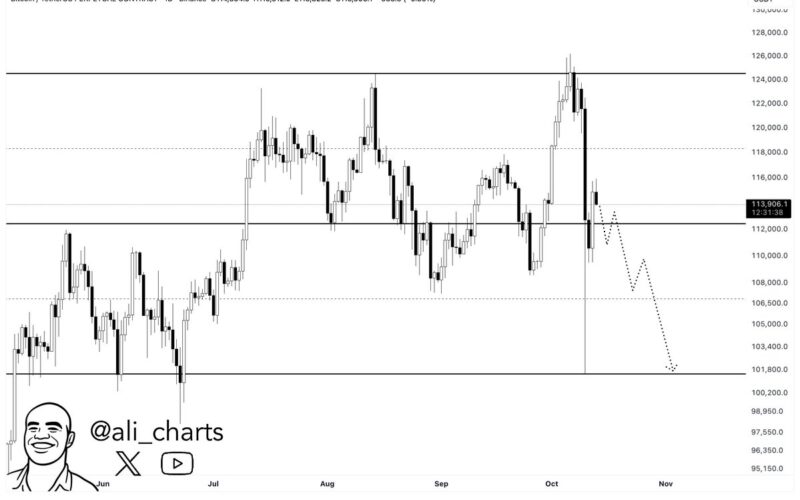
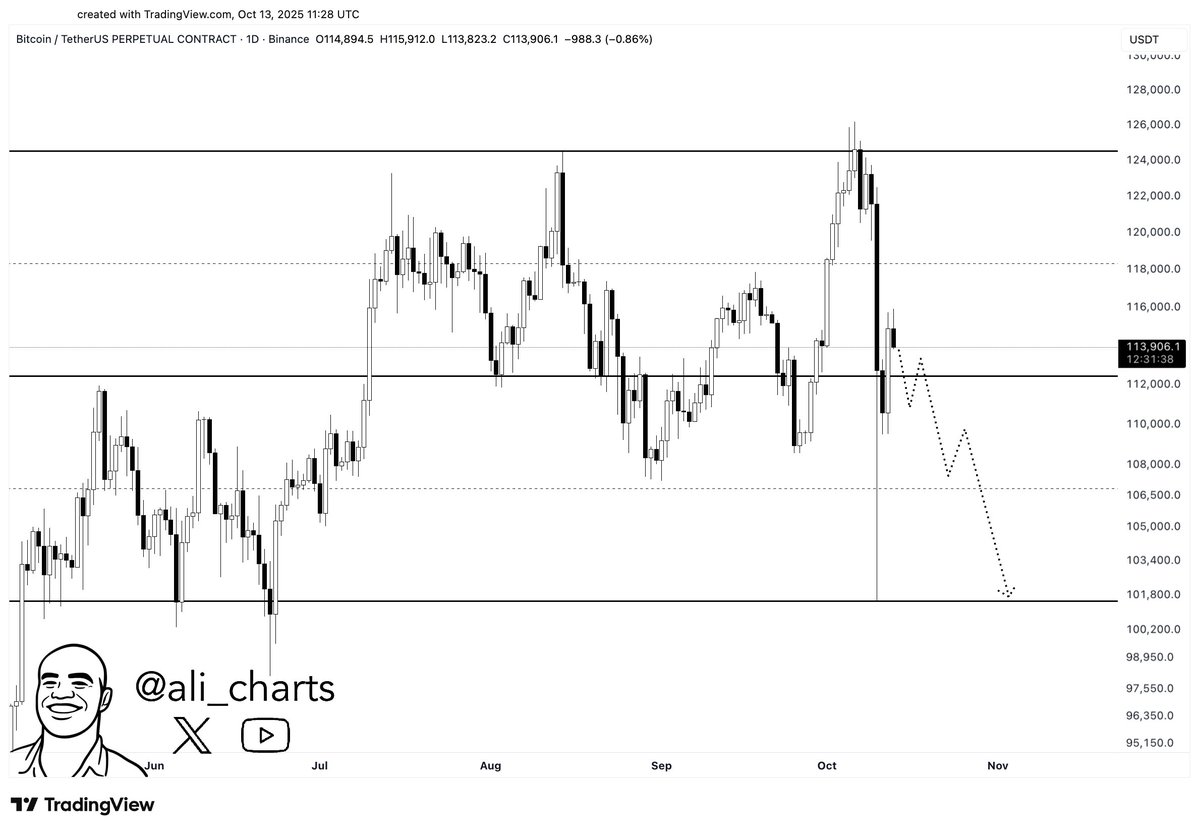
Ali Martinez posted a chart showing that Bitcoin could drop further if it fails to hold current support. His chart shows possible steps lower, with stops at $108,000 and $106,500. The lowest level on the chart points to $101,800.
Martinez asked, “What are the odds Bitcoin revisits $100,000?” suggesting a deeper pullback could happen if sellers keep control.
Another analyst, Ted, noted that BTC was rejected at $116,000. He pointed to the $110,000–$111,000 area as the next important level. This zone also holds a CME gap. He added,
“If Bitcoin holds this level, we could see a bounce back.”
If not, a move toward $107,000 may follow.
Sentiment Drops to Multi-Year Lows
Social data shows that Bitcoin sentiment has fallen sharply. Ali Martinez shared a chart showing a weighted sentiment reading of -1.55, the lowest level in several years. This follows the October 10 sell-off, when Bitcoin dropped immediately on news of trade tensions.
Despite the negative mood, some on-chain analysts say the structure remains intact. XWIN Research Japan reviewed five major liquidation events in Bitcoin’s history and found that each one was followed by a recovery.
“Mass liquidations are no longer signs of collapse but cleansing phases.”
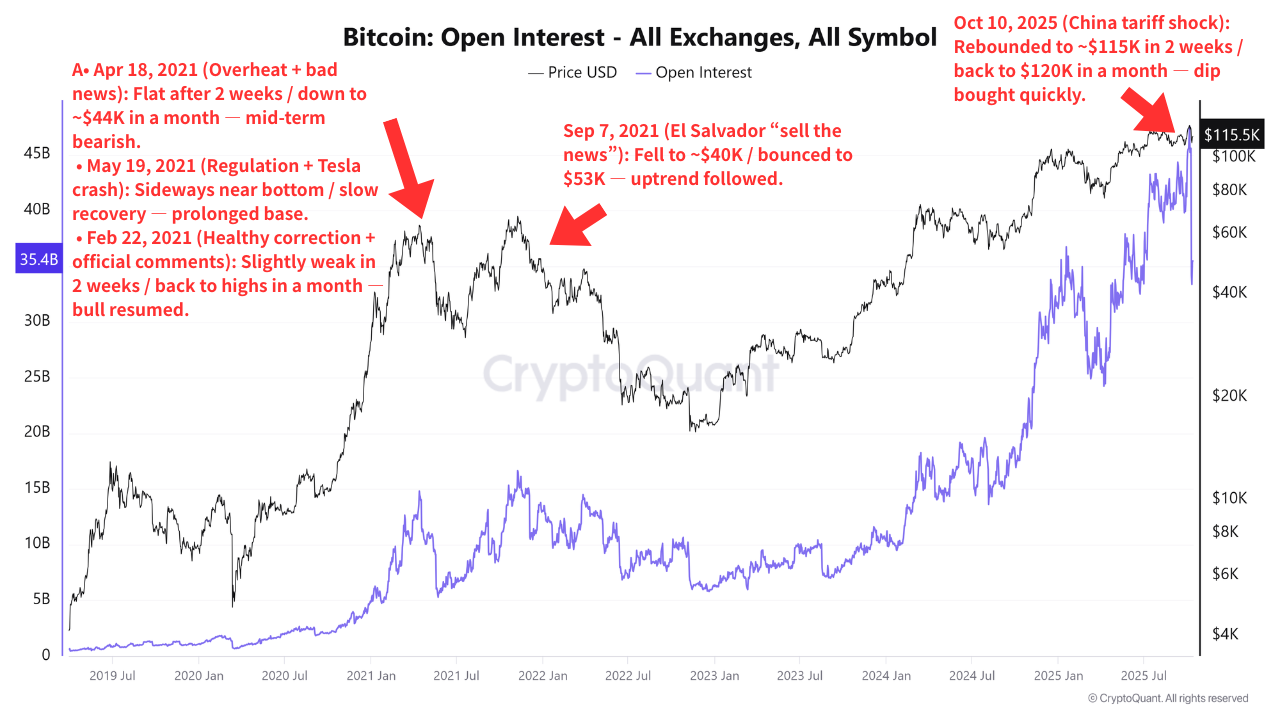
Bitcoin’s recent crash erased nearly $19 billion in open interest. Data now shows that leverage has reset, funding rates have normalized, and spot buying is returning.
The post $100K BTC? Bitcoin Chart Signals Possible Pullback Amid Volatility appeared first on CryptoPotato.


